Connecting the MH-Z19B sensor based on Arduino Mega 2560 for CO2 monitoring with VizIoT
In this article, we will thoroughly examine the process of connecting the MH-Z19B carbon dioxide sensor to the MEGA 2560 microcontroller and using the VizIoT platform to monitor CO2 levels in real-time.
Required components:
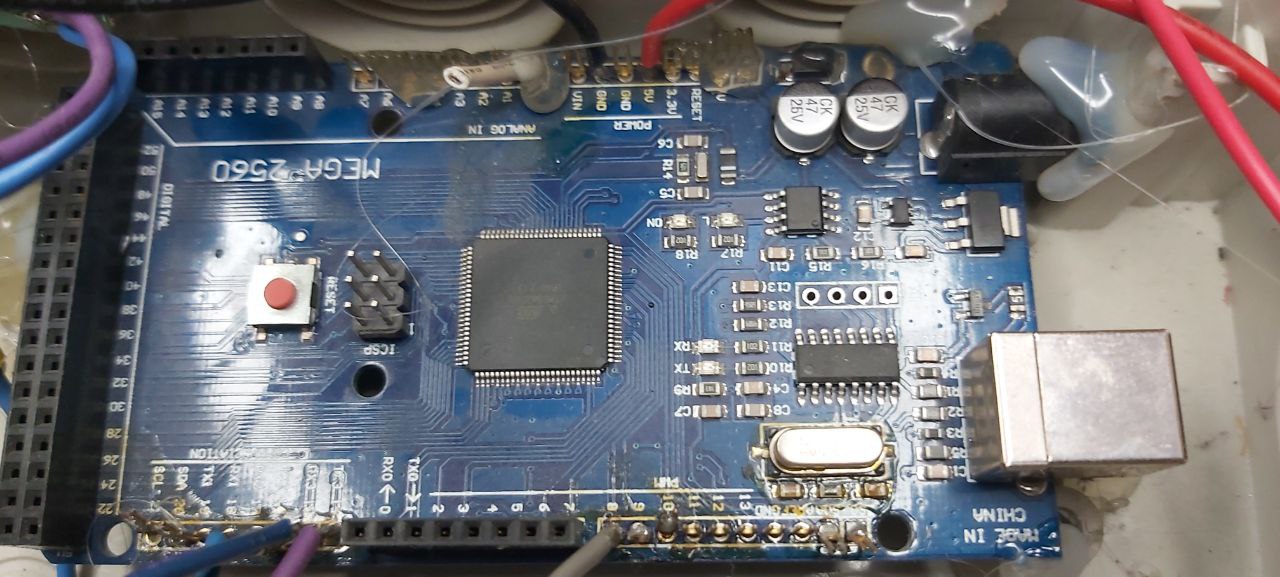
- Arduino Mega 2560
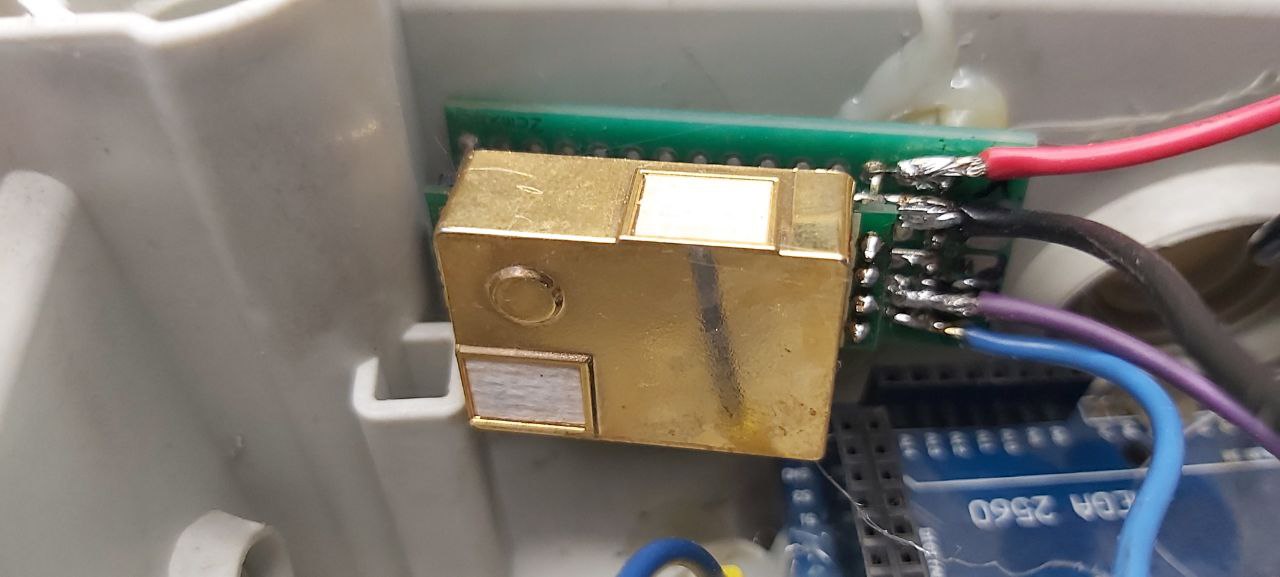
- MH-Z19B Sensor
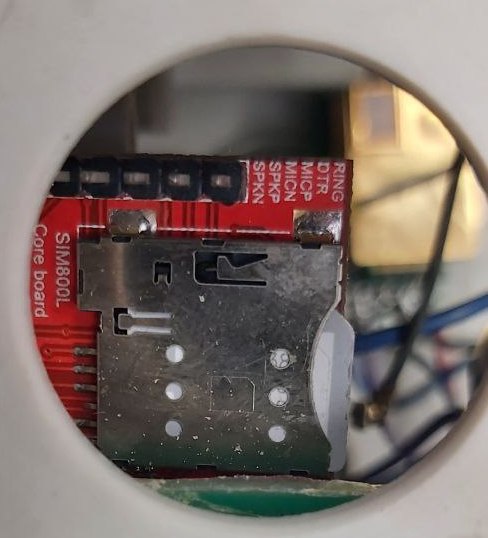
- SIM800L Module + SIM card with an active data plan
- Connecting wires
- Power supply for the SIM800L module (recommended 4V-5V)
- Computer with Arduino IDE installed
- VizIoT platform for data visualization
Connection diagram:
Connecting the SIM800L module to the Arduino Mega 2560 is simple if you follow these steps:
Power:
- Connect the power "+" of the power source to the 5V pin of the MEGA 2560 module.
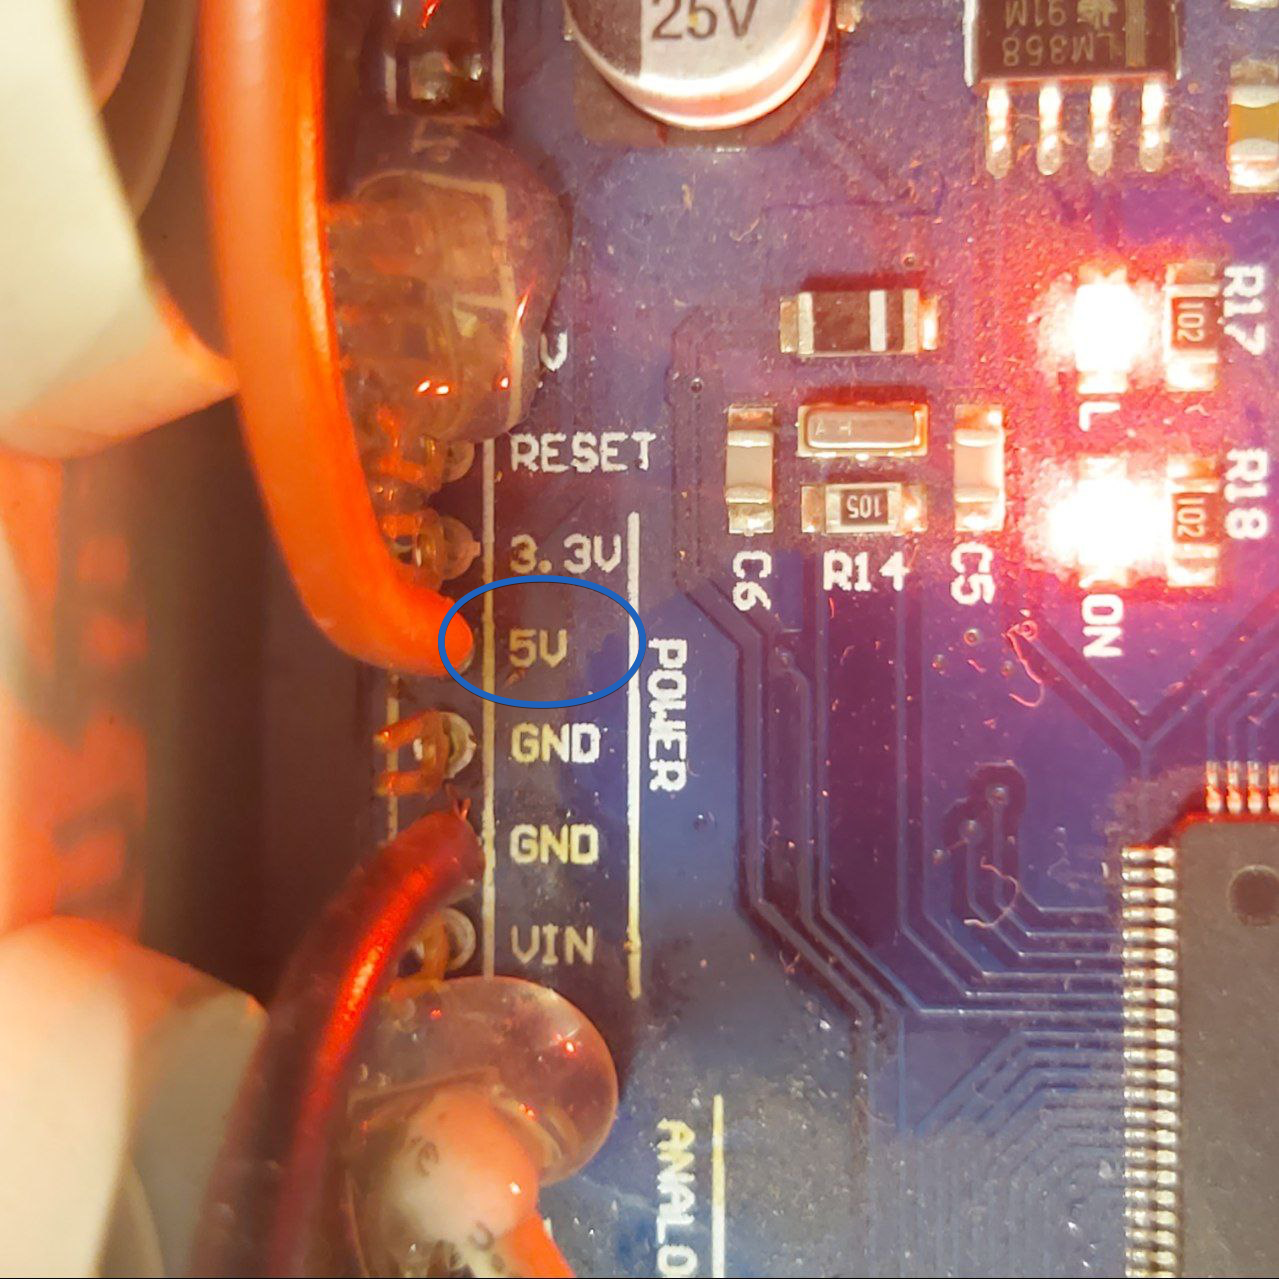
- Power the
VCCof the SIM800L module from a 4.2V-4.4V power source. The SIM800L module can be sensitive to voltage, so it's better to use a separate power source. - Connect
GNDof the SIM800L module to theGNDof the power source and theGNDof Arduino Mega.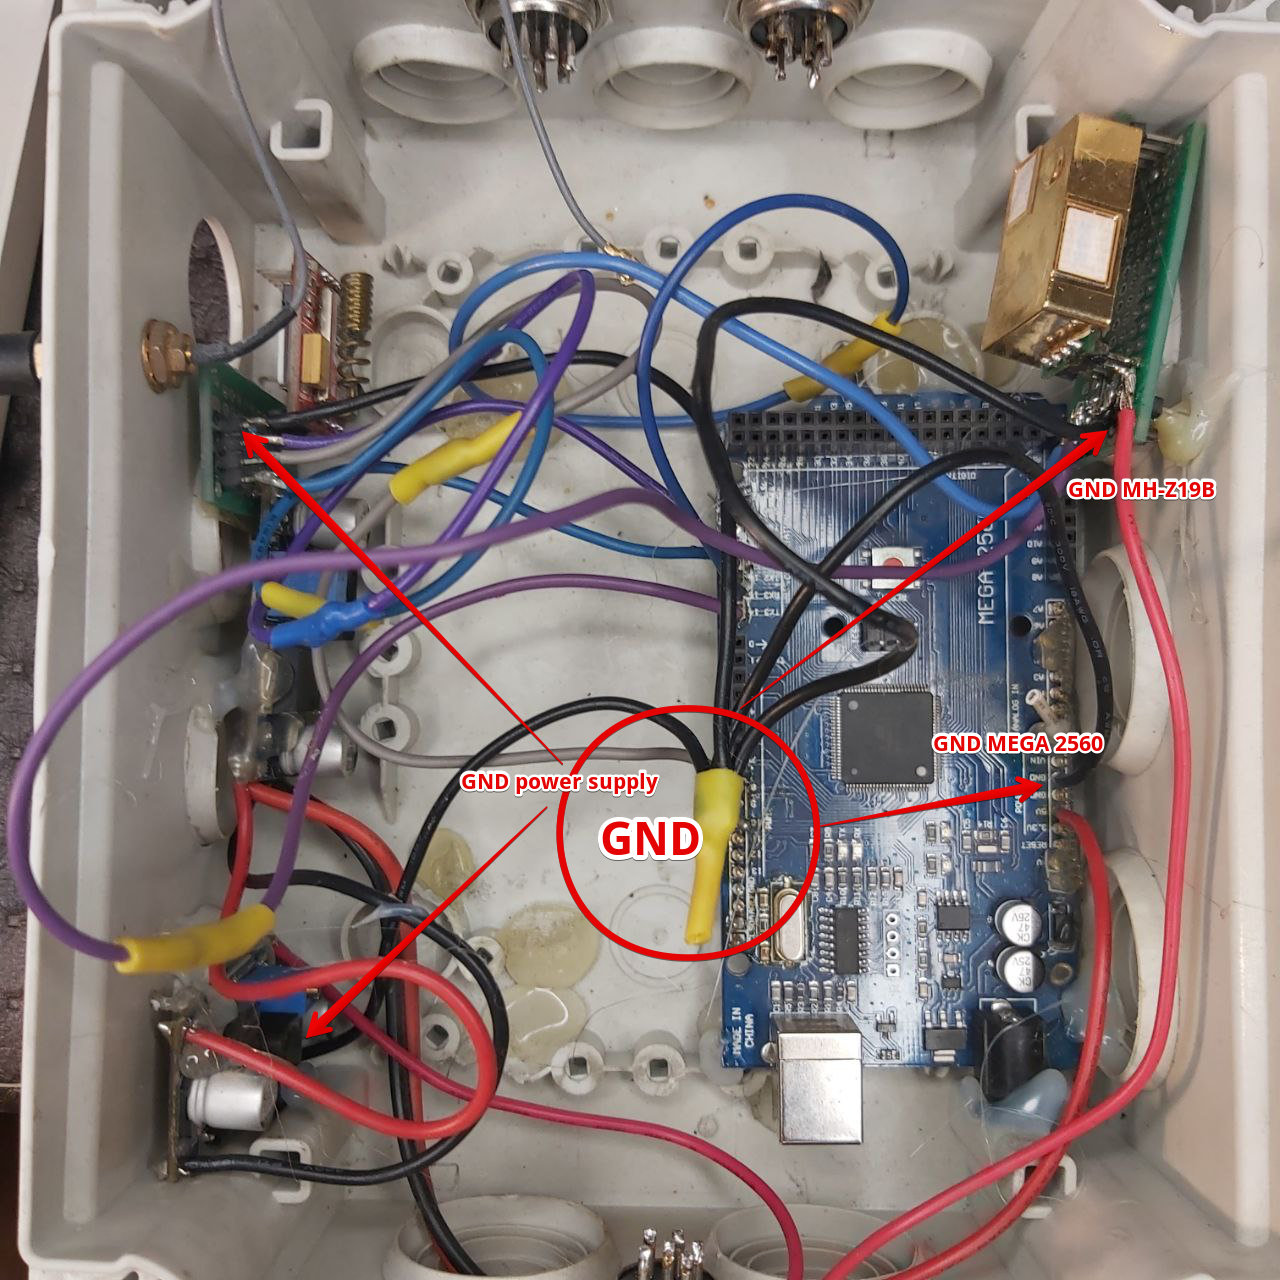
Control the module according to the following connection scheme:
- Connect the
TXpin of the SIM800L module to theRX2(#17) pin on Arduino Mega. - Connect the
RXpin of the SIM800L module to theTX2(#16) pin on Arduino Mega via a voltage divider (resistors of equal value in the range of 1-10 kOhm). Connection Diagram: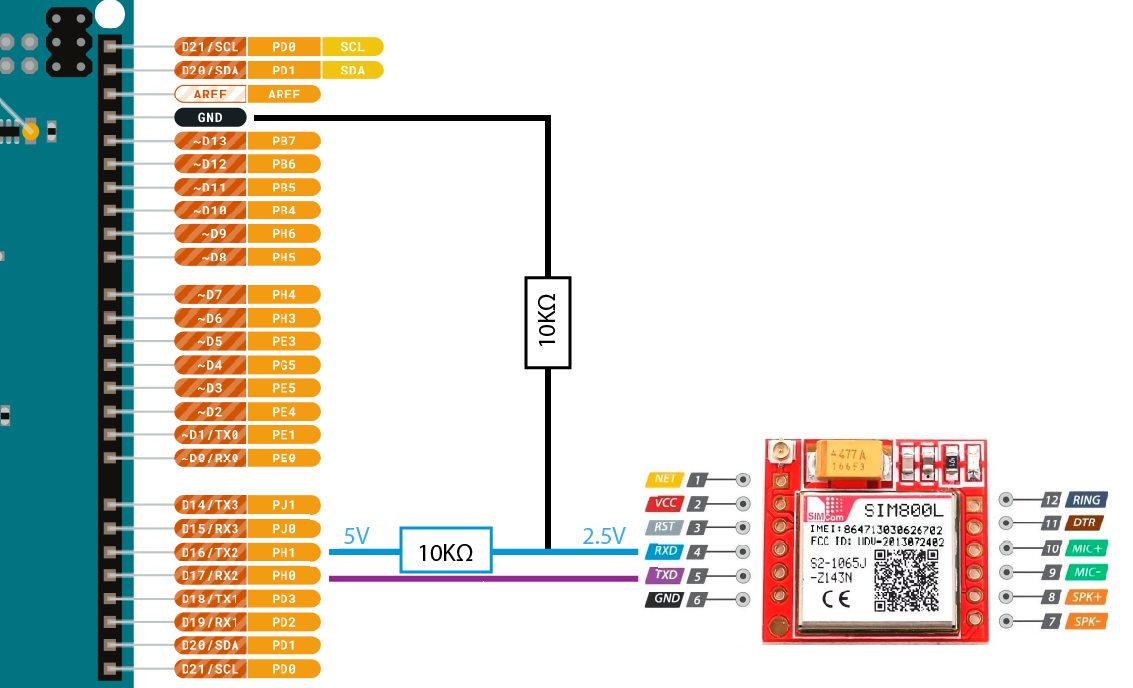
Example Code:
Here is a simple example code to check the connection and send AT commands to the SIM800L module:
void setup() {
  // Start communication with Serial Monitor
  Serial.begin(9600);
  // Start communication with SIM800L using Serial2
  Serial2.begin(9600);

  // Pause to allow the module to initialize
  delay(1000);

  Serial.println("Sending AT command...");
  Serial2.println("AT");

  // Wait for a response
  delay(1000);

  // Check if data is available
  if (Serial2.available()) {
    while (Serial2.available()) {
      char c = Serial2.read();
      Serial.print(c);
    }
  } else {
    Serial.println("No response from SIM800L.");
  }
}
void loop() {
  // Empty loop as all the work is done in setup()
}
Testing the Setup:
- Connect the Arduino to the computer and open the Serial Monitor in the Arduino IDE.
- Set the port speed to 9600 baud.
- Upload the sketch to the Arduino MEGA 2560.
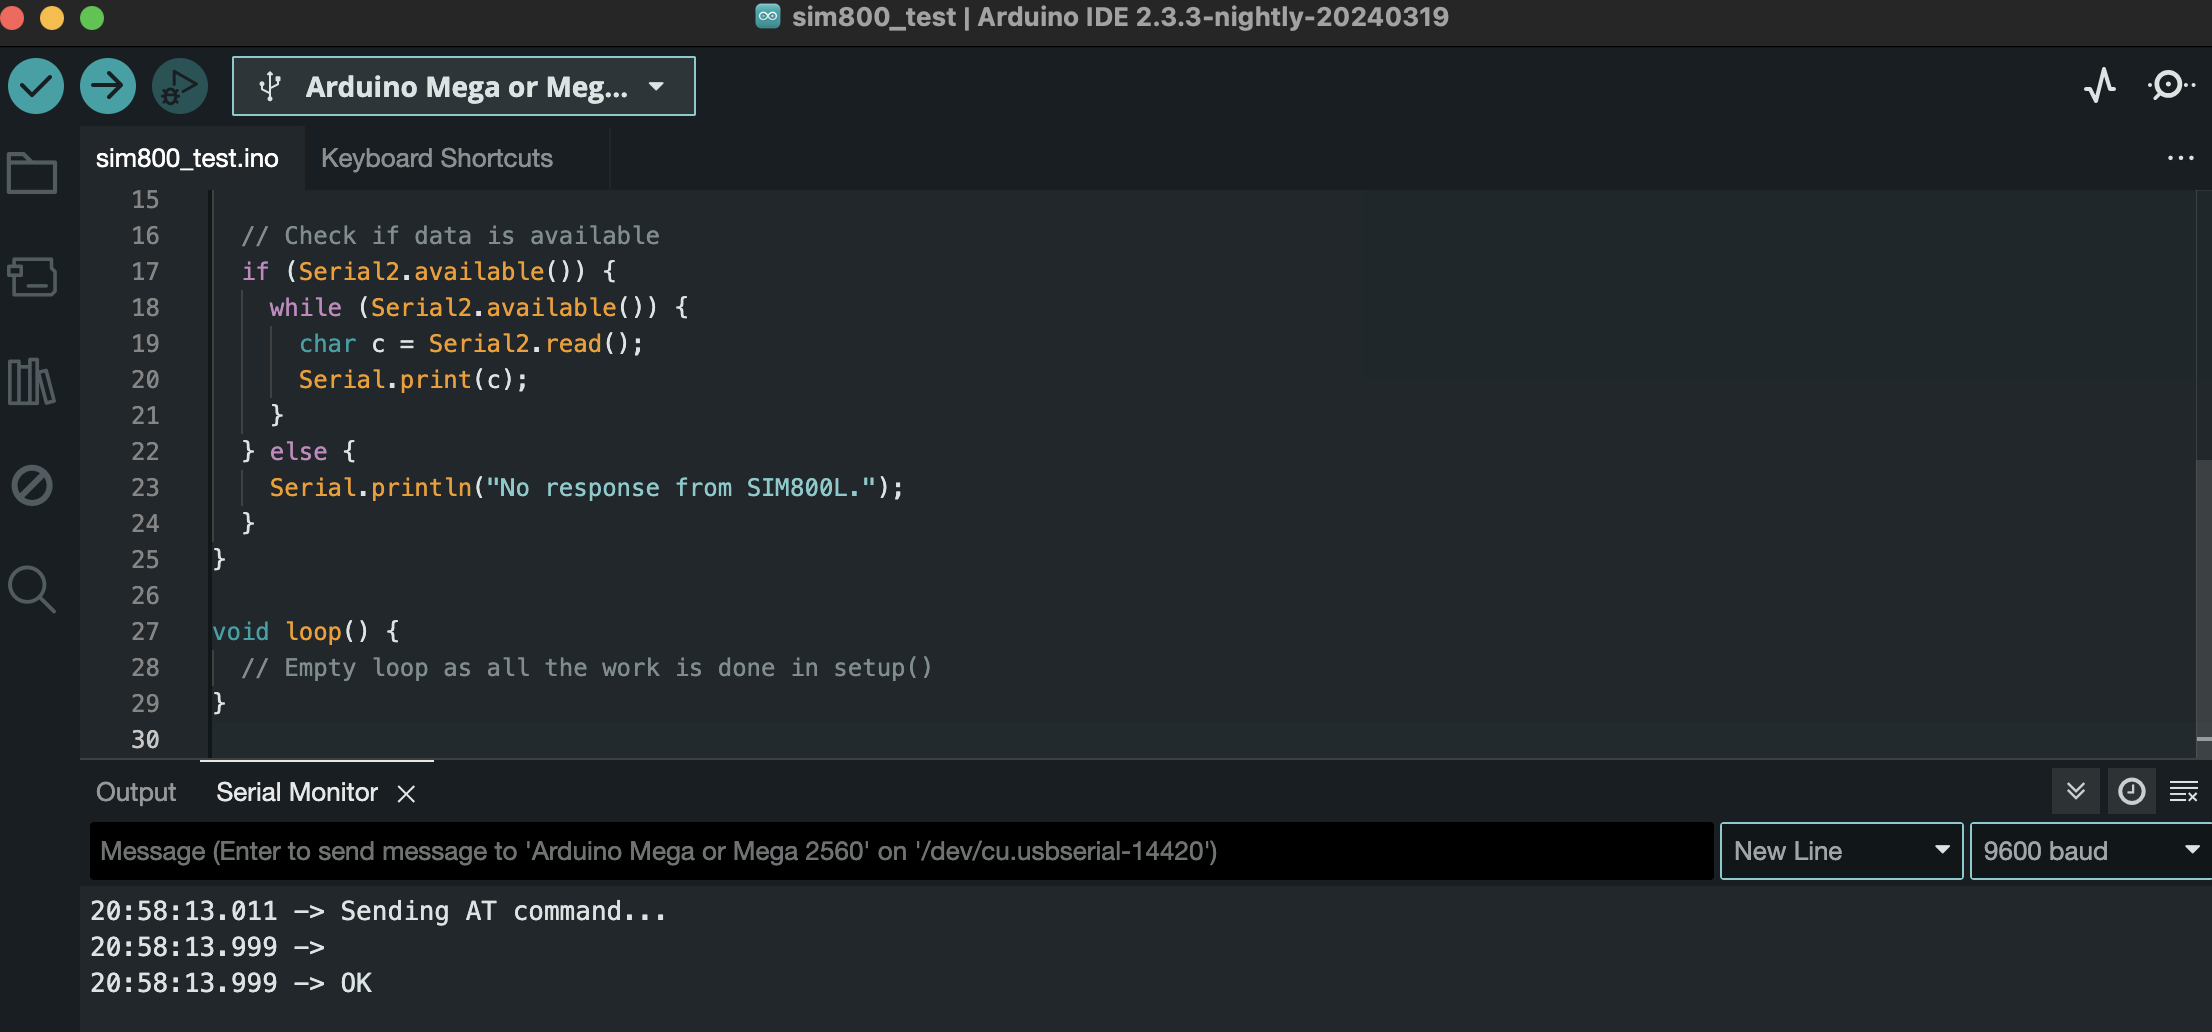
- In the Serial Monitor, you should see the message "Sending AT command..." followed by the response from the module.
If you receive an "OK" response, the module is successfully connected and ready for use.
Connecting the MH-Z19B sensor to Arduino Mega 2560:
Required components:
- MH-Z19B Sensor
- Arduino Mega 2560
- Connecting wires
Connection Diagram:
Power:
- Connect
VCCof the MH-Z19B sensor to5Von Arduino Mega 2560. - Connect
GNDof the MH-Z19B module toGNDof the power source andGNDof Arduino Mega.
Signal lines:
- Connect
TXof the MH-Z19B sensor toRX3(pin 15) on Arduino Mega 2560. - Connect
RXof the MH-Z19B sensor toTX3(pin 14) on Arduino Mega 2560.
Example code to read data from the MH-Z19B sensor:
void setup() {
  // Start communication with Serial Monitor
  Serial.begin(9600);
  // Start communication with MH-Z19B using Serial3
  Serial3.begin(9600);

  // Pause to allow the module to initialize
  delay(1000);

  Serial.println("Requesting data from MH-Z19B...");
}

void loop() {
  // Send command to request data
  byte cmd[9] = {0xFF, 0x01, 0x86, 0x00, 0x00, 0x00, 0x00, 0x00, 0x79};
  Serial3.write(cmd, 9);

  // Pause to receive data
  delay(1000);

  // Check if data is available
  if (Serial3.available()) {
    byte response[9];
    for (int i = 0; i < 9; i++) {
      response[i] = Serial3.read();
    }

    if (response[0] == 0xFF && response[1] == 0x86) {
      int co2 = response[2] * 256 + response[3];
      Serial.print("CO2 Concentration: ");
      Serial.print(co2);
      Serial.println(" ppm");
    } else {
      Serial.println("Invalid response from MH-Z19B.");
    }
  } else {
    Serial.println("No response from MH-Z19B.");
  }

  // Pause before next request
  delay(5000);
}
Testing the Response:
- Connect the Arduino to the computer and open the Serial Monitor in the Arduino IDE.
- Set the port speed to 9600 baud.
- Upload the sketch to the Arduino MEGA 2560.
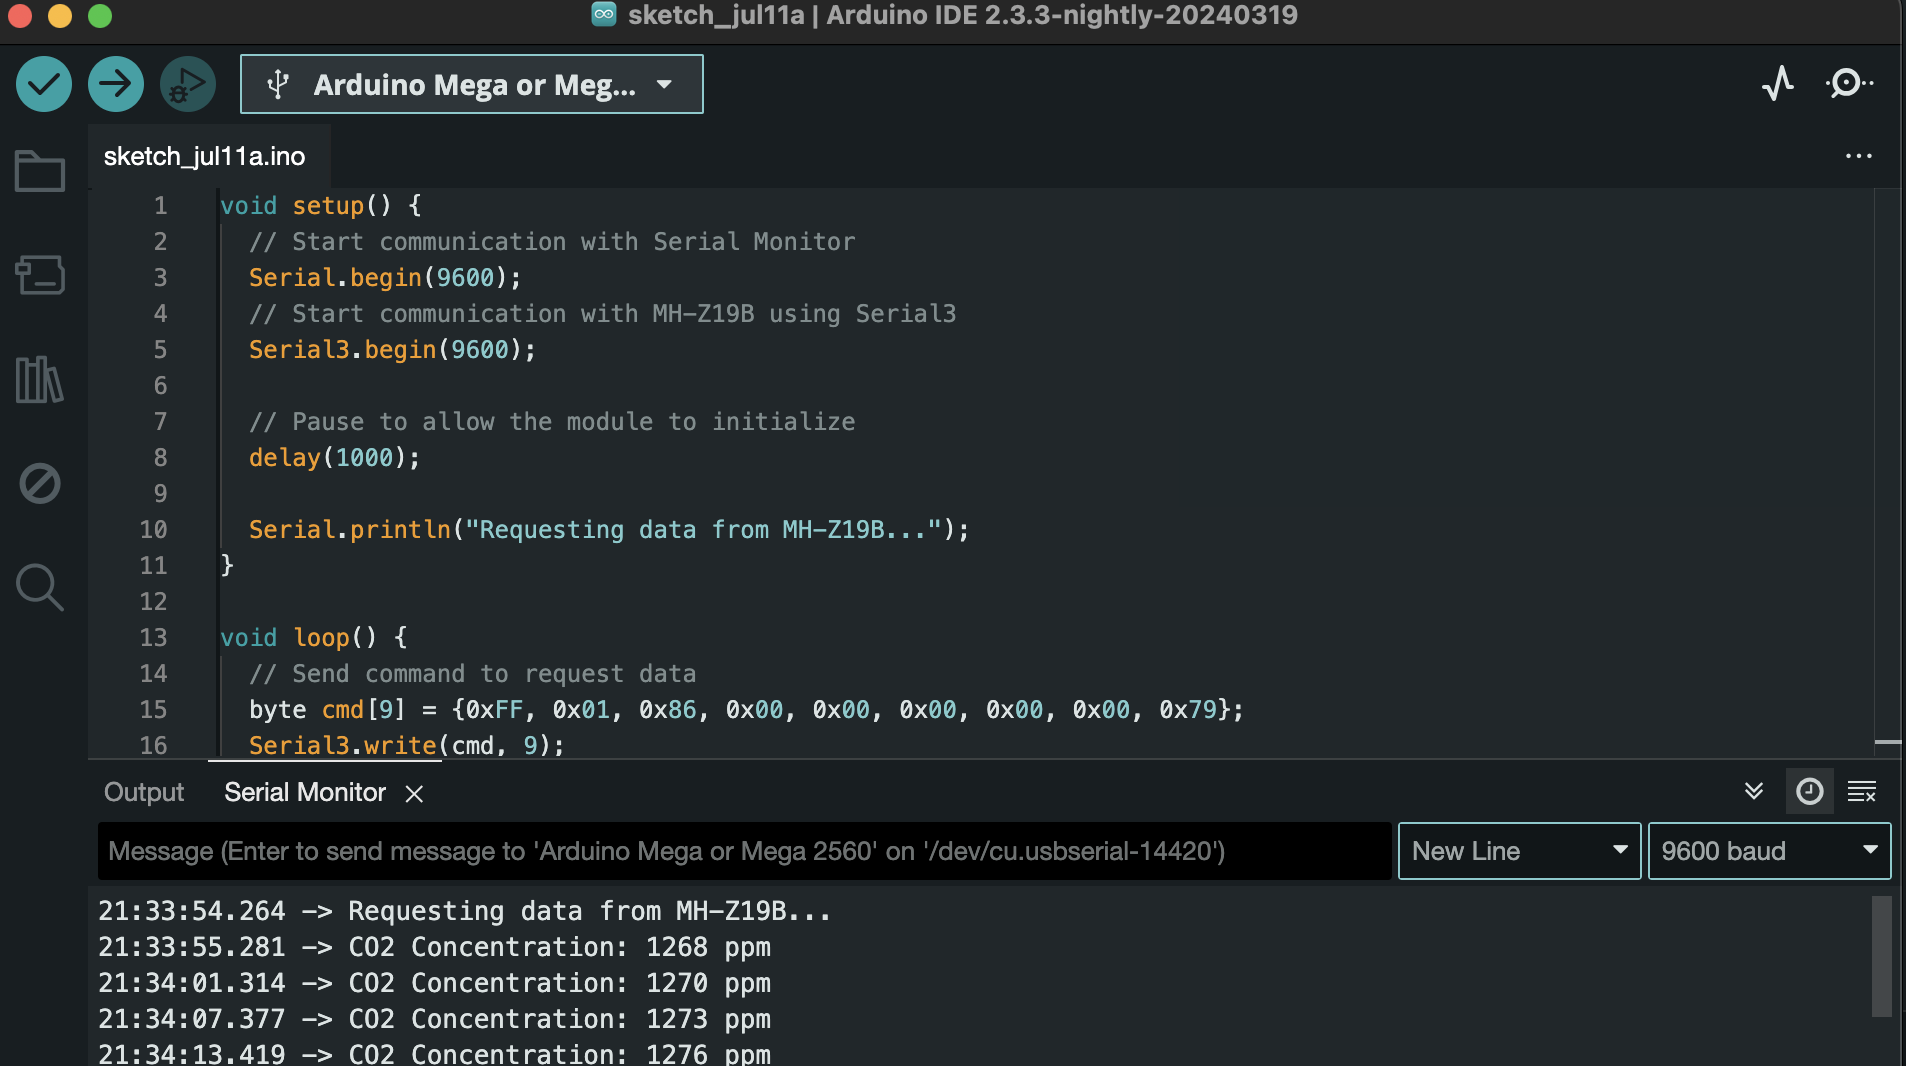
If you receive a CO2 concentration value, the sensor is successfully connected and working correctly.
Example of sending CO2 concentration readings from an apartment every 5 minutes
Adding and configuring the device:
The process of connecting new devices to the VizIoT server has been detailed in previous articles. Here’s a brief overview of how to do this using today's example:
- Add a new device in VizIoT with the name "CO2".
- Configure the device parameters by adding the parameter: Key co2 with the type "Carbon Dioxide, ppm".
- In the device's "Basic settings", copy the Key access and Password access.
Arduino firmware:
- Create a new project in the Arduino IDE.
- Copy the example below into the created project.
#define TINY_GSM_MODEM_SIM800
#define USED_MH_Z19B true

#include <TinyGsmClient.h>
#include <ArduinoHttpClient.h>
#include <Wire.h>

#define SerialMon Serial
// Use the physical Serial port for Mega, Leonardo, Micro
#define SerialAT Serial2

//access point settings which is required to connect the GSM module to the GPRS network
const char apn[] = "www.kyivstar.net";
const char user[] = "";
const char pass[] = "";

// VizIoT Device access key and password (can be found in the device settings)
String VizIoT_Device_key = "XXXX";
String VizIoT_Device_pass = "XXXX";

// Server address and port
const char server[] = "VizIoT.com";
const int port = 80;

TinyGsm modem(SerialAT);
TinyGsmClient client(modem);
HttpClient http(client, server, port);

void setup() {
  // Set baud rate for Serial Monitor
  SerialMon.begin(9600);
  Serial3.begin(9600); // Serial3 port for communication with the MH-Z19B sensor
  Serial.println("MH-Z19B CO2 Sensor Test");

  delay(10);

  // Set baud rate for GSM module
  SerialAT.begin(9600);
  delay(3000);

  SerialMon.println(F("Initializing modem..."));
  modem.restart();

  String modemInfo = modem.getModemInfo();
  SerialMon.print(F("Modem: "));
  SerialMon.println(modemInfo);
}

void loop() {
  SerialMon.print(F("Waiting for network..."));
  if (!modem.waitForNetwork()) {
    SerialMon.println(" fail");
    delay(10000);
    return;
  }

  SerialMon.println(" OK");

  SerialMon.print(F("Connecting to access point "));
  SerialMon.print(apn);

  if (!modem.gprsConnect(apn, user, pass)) {
    SerialMon.println(" failed");
    delay(10000);
    return;
  }

  SerialMon.println(" OK");
  SerialMon.print(F("Sending HTTP GET request... "));

  int err = http.get(getResource().c_str());

  if (err != 0) {
    SerialMon.println(F("connection error"));
    delay(10000);
    return;
  }

  // Reading and displaying the response
  int statusCode = http.responseStatusCode();
  SerialMon.print(F("HTTP "));
  SerialMon.println(statusCode);

  if (statusCode == 200) {
    String response = http.responseBody();
    SerialMon.print(F("Response: "));
    SerialMon.println(response);
  }

  http.stop();
  SerialMon.println(F("Disconnected from server"));

  modem.gprsDisconnect();
  SerialMon.println(F("GPRS disconnected"));

  // Sleep for 5 minutes
  //delay(0.3 * 60 * 1000);
  delay(5.0 * 60 * 1000);
}

String getResource() {
  // Reading data from the MH-Z19B sensor
  int CO2 = readCO2();

  String resource = String("/update?key=") + VizIoT_Device_key + "&" + "pass=" + VizIoT_Device_pass;
  resource += String("&co2=") + CO2;

  return resource;
}

int readCO2() {
  byte cmd[9] = {0xFF, 0x01, 0x86, 0, 0, 0, 0, 0, 0x79};
  byte response[9];

  // Clear the serial port buffer before sending the command to avoid reading old data
  while (Serial3.available()) {
    Serial3.read();
  }

  Serial3.write(cmd, 9);

  // Waiting for data with timeout
  unsigned long startTime = millis();
  while (Serial3.available() < 9) {
    if (millis() - startTime > 1000) { // 1000 ms = 1 second timeout, waiting for data (1 second) to prevent the program from getting stuck if there is no response
      SerialMon.println("Error: CO2 read timeout");
      return -1;
    }
  }

  // Reading data, checking the number of bytes read before processing
  Serial3.readBytes(response, 9);

  // Check the response header
  if (response[0] != 0xFF || response[1] != 0x86) {
    SerialMon.println("Error reading CO2");
    return -1;
  }

  // Calculate CO2 value
  int CO2 = (response[2] << 8) + response[3];
  // Output the CO2 value to the monitor
  SerialMon.print("CO2: ");
  SerialMon.println(CO2);

  return CO2;
}
Install the following libraries:
- "TinyGsmClient.h" for SIM800 GSM module.
- "ArduinoHttpClient.h" for HTTP protocol.
- "Wire.h" for WIFI network.
To ensure the correct operation of the code, specify the values for the following variables:
apn– Name of the GSM access point. In this context,apnis used to store the access point name (Access Point Name), which is required to connect the GSM module to the GPRS network.VizIoT_Device_key– copied Device Access Key.VizIoT_Device_pass– copied Device Access Password.
Connect the Arduino to the computer and upload the sketch.
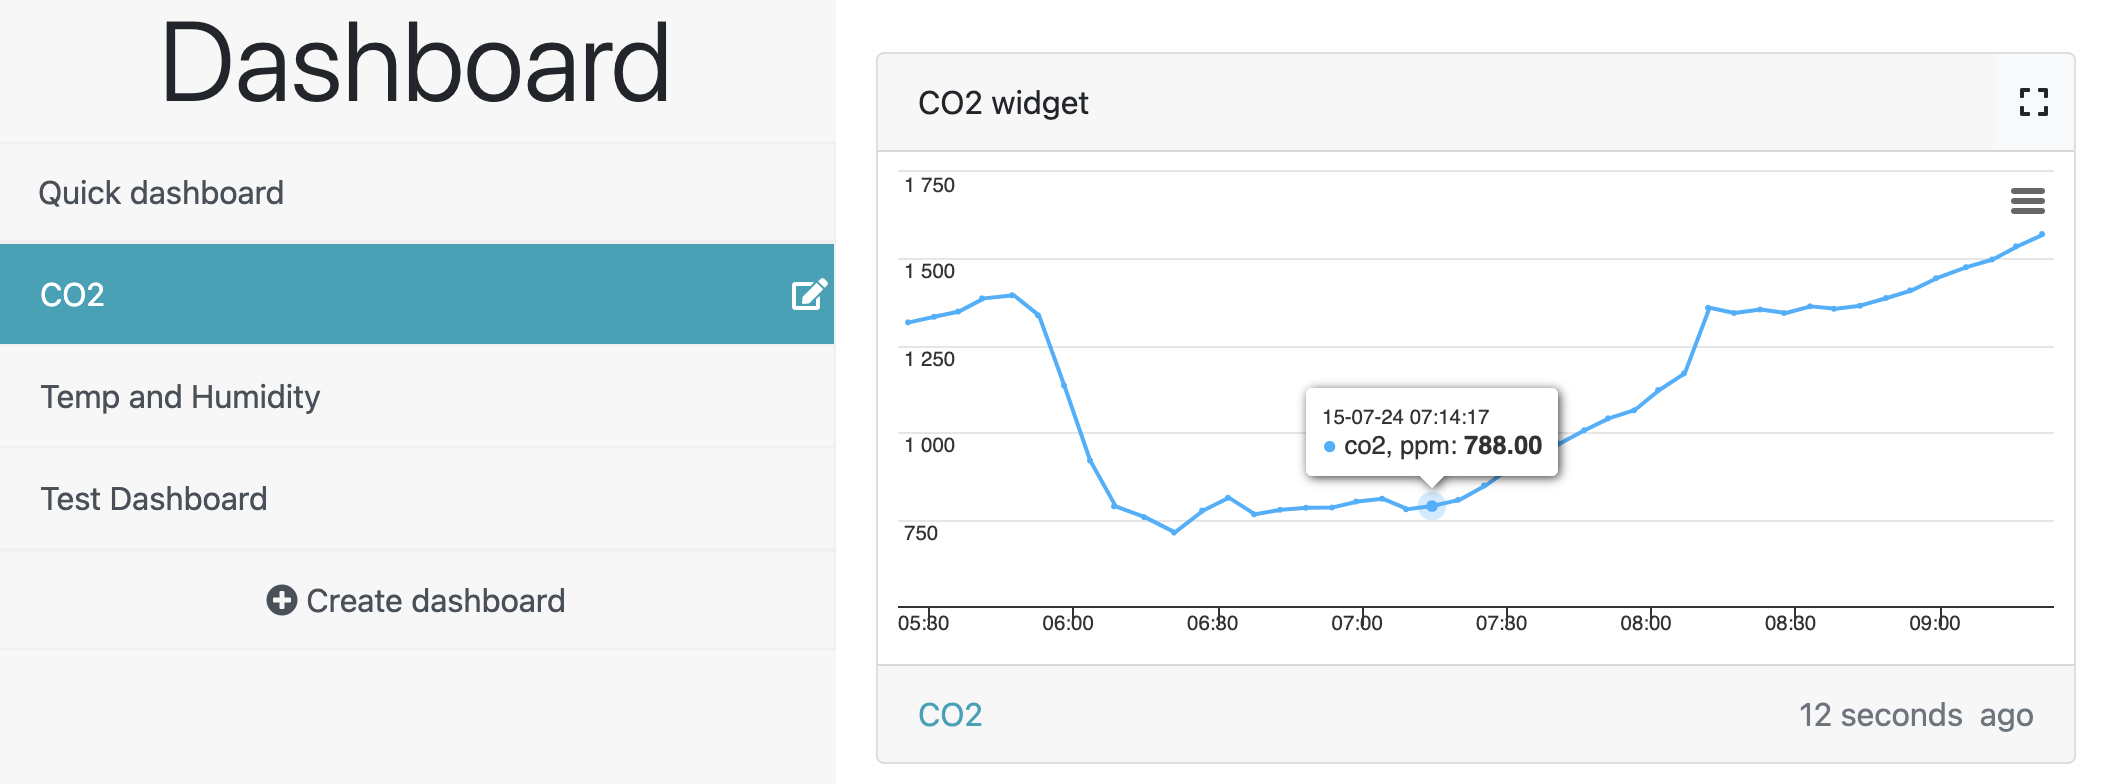
Adding Widgets:
- Go to the VizIoT website and create a new dashboard named "CO2".
- Add a widget named "CO2 widget".
Set the following parameters:
- Type: "Chart";
- Device: "CO2";
- Parameter: co2;
Data Visualization
After successfully setting up the connection, you can monitor CO2 concentration data in real-time on the VizIoT dashboard. You also have the ability to configure charts, alert settings, and other elements for convenient and efficient monitoring.
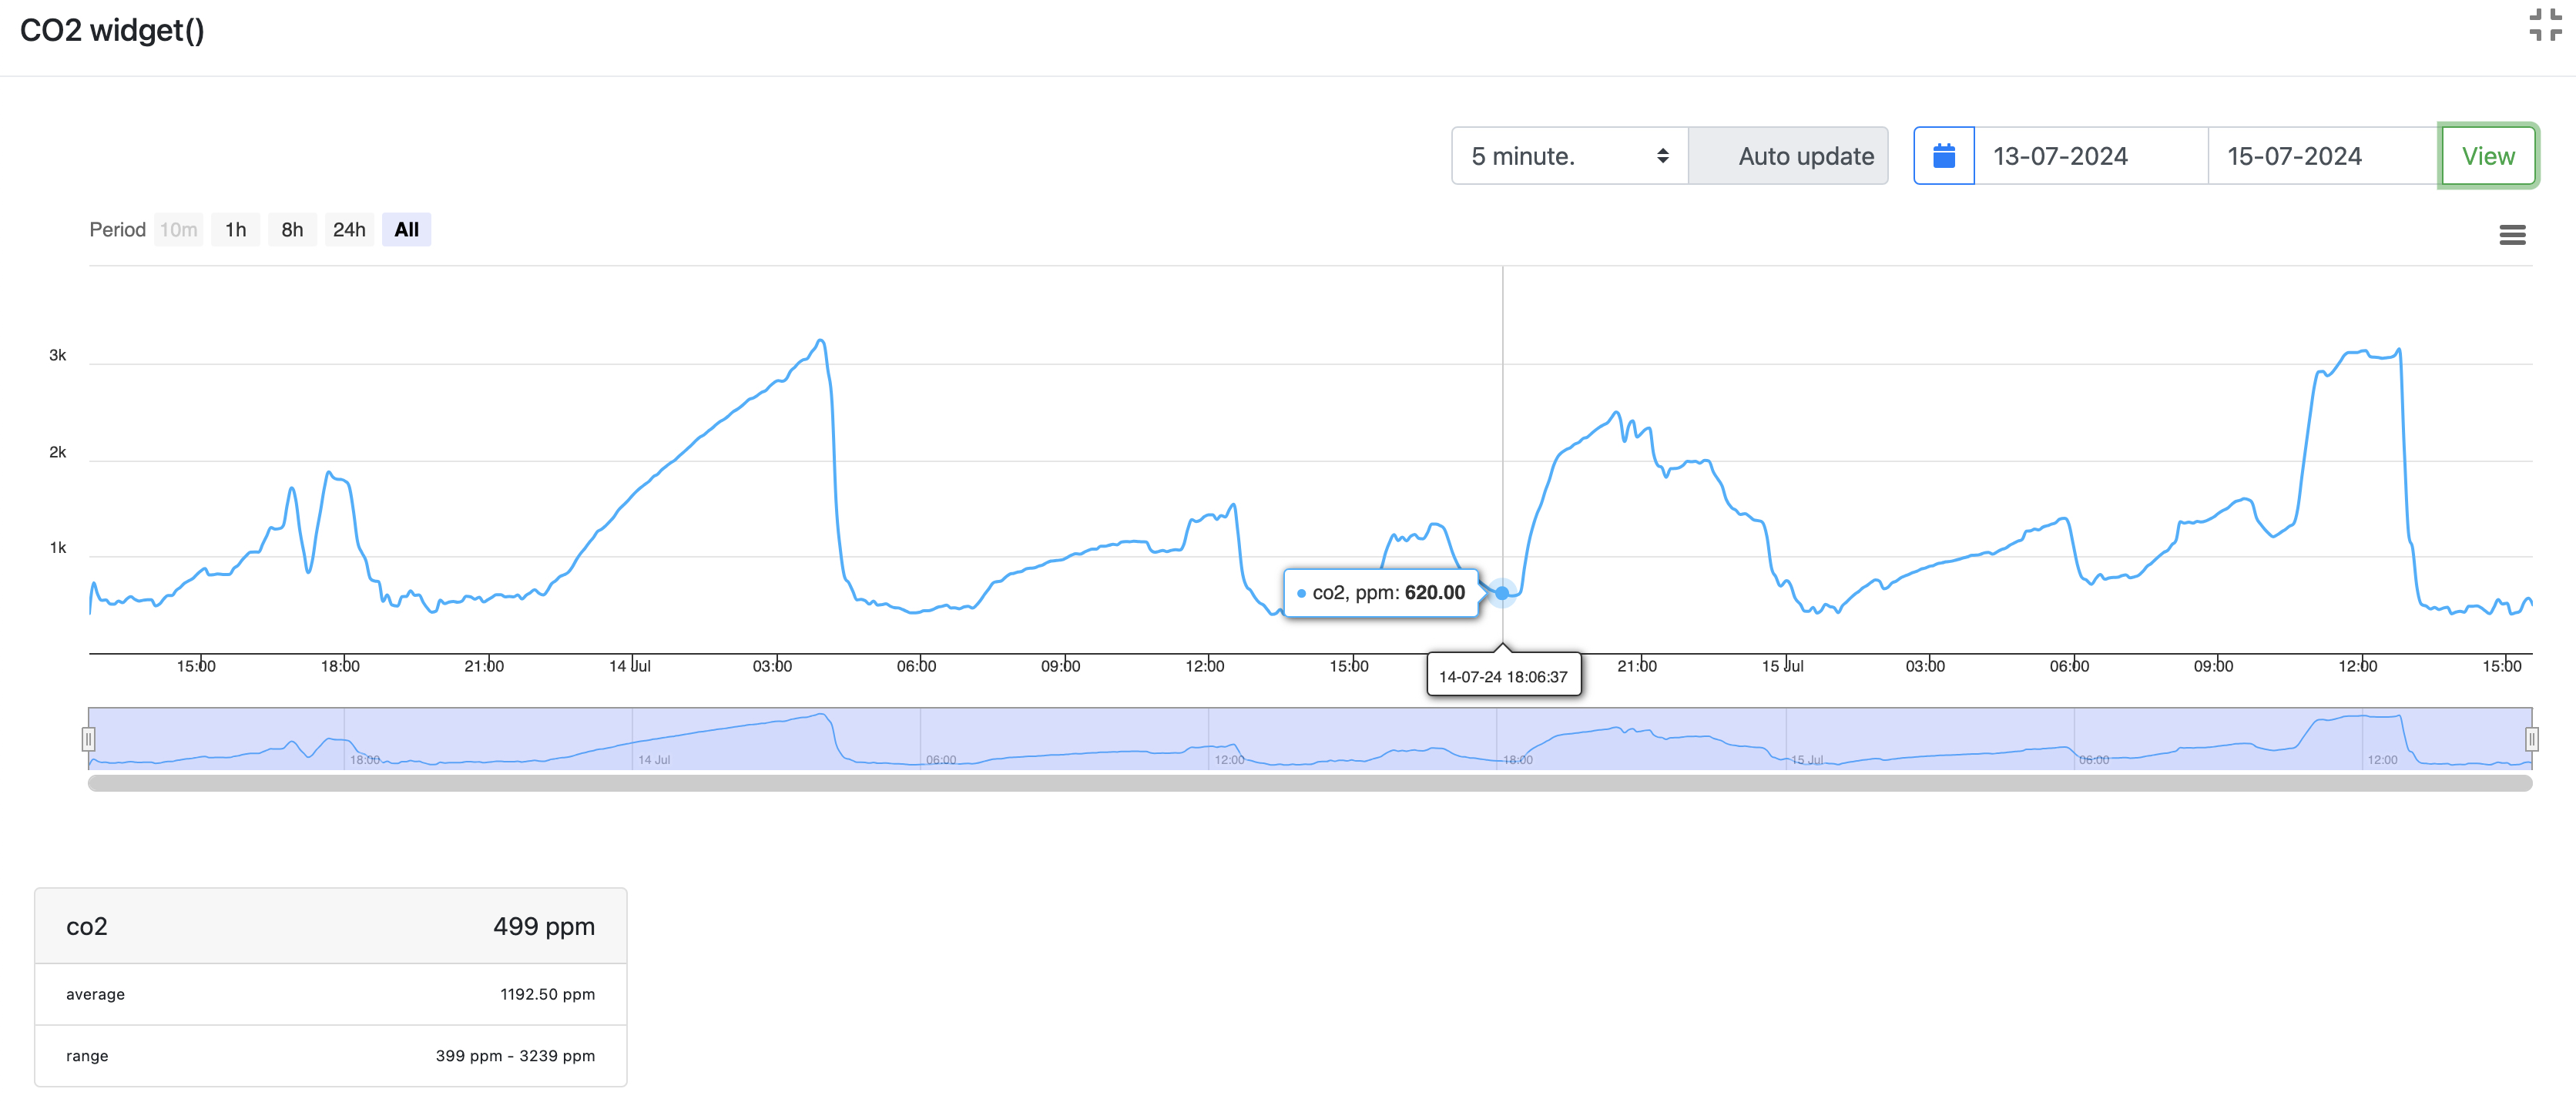
Graph Description
The graph shows the CO2 concentration in the room from July 13 to July 15, 2024. Let's look at the main points:
CO2 Concentration:
- Maximum value: 3239 ppm
- Average value: 1192 ppm
- Current value: 499 ppm
Time Analysis:
- Concentration peaks (approximately 1500-3200 ppm) indicate times when there were 3-5 people in the room with closed windows. This is observed at night and evening on July 13 and 14.
- Concentration dips (below 500 ppm) may indicate moments when the room was ventilated or fewer people were present.
Ventilation Recommendations:
- When to ventilate: According to the graph, ventilation should be carried out in the morning and evening when CO2 concentrations peak.
- Why ventilate: High levels of CO2 (more than 1000 ppm) can cause fatigue, decreased concentration, and other negative health effects. Regular ventilation helps maintain an optimal air quality level.
Comment on the Graph
The graph shows changes in CO2 levels during the analyzed period. Key observations include:
- Maximum peaks of CO2 levels reached over 3000 ppm, indicating periods of high activity or poor ventilation.
- Average CO2 value for the period is about 1192 ppm, slightly above the recommended level for residential premises.
- Analysis of changes shows that CO2 levels are highest in the evening and night, likely due to more people in the room and closed windows.
- The current value of CO2 at the time of the last measurement is 499 ppm, which does not exceed the recommended limits.
Usage:
Personal (Apartment/House):
- Ventilation in the morning and evening: Start your day with a refreshing breath of fresh air! Open the windows in the morning to energize yourself before starting an active day. And in the evening, ventilation will help relieve fatigue and prepare the room for a restful night. When the whole family gathers at home, this is especially important for maintaining good well-being.
- Creating a comfortable microclimate: Regular ventilation helps avoid excess moisture and unpleasant odors, improving air quality and creating a pleasant atmosphere in the house.
Commercial (Office/Public Places):
- Regular ventilation during working hours: Fresh air helps increase productivity and improve employee concentration. Ventilation during the working day will help avoid CO2 buildup and create comfortable working conditions.
- Automatic ventilation: Install automatic ventilation systems that will maintain optimal CO2 levels without the need for constant control. This is especially important in high-traffic areas such as offices, cafes, and other public places.
- Creating a healthy work environment: Maintaining good air quality in the office not only improves employee well-being but also reduces the risk of illness, increasing overall efficiency and team morale.
To improve indoor conditions, it is recommended to monitor CO2 levels using sensors and ventilate the room when the concentration exceeds 1000 ppm.
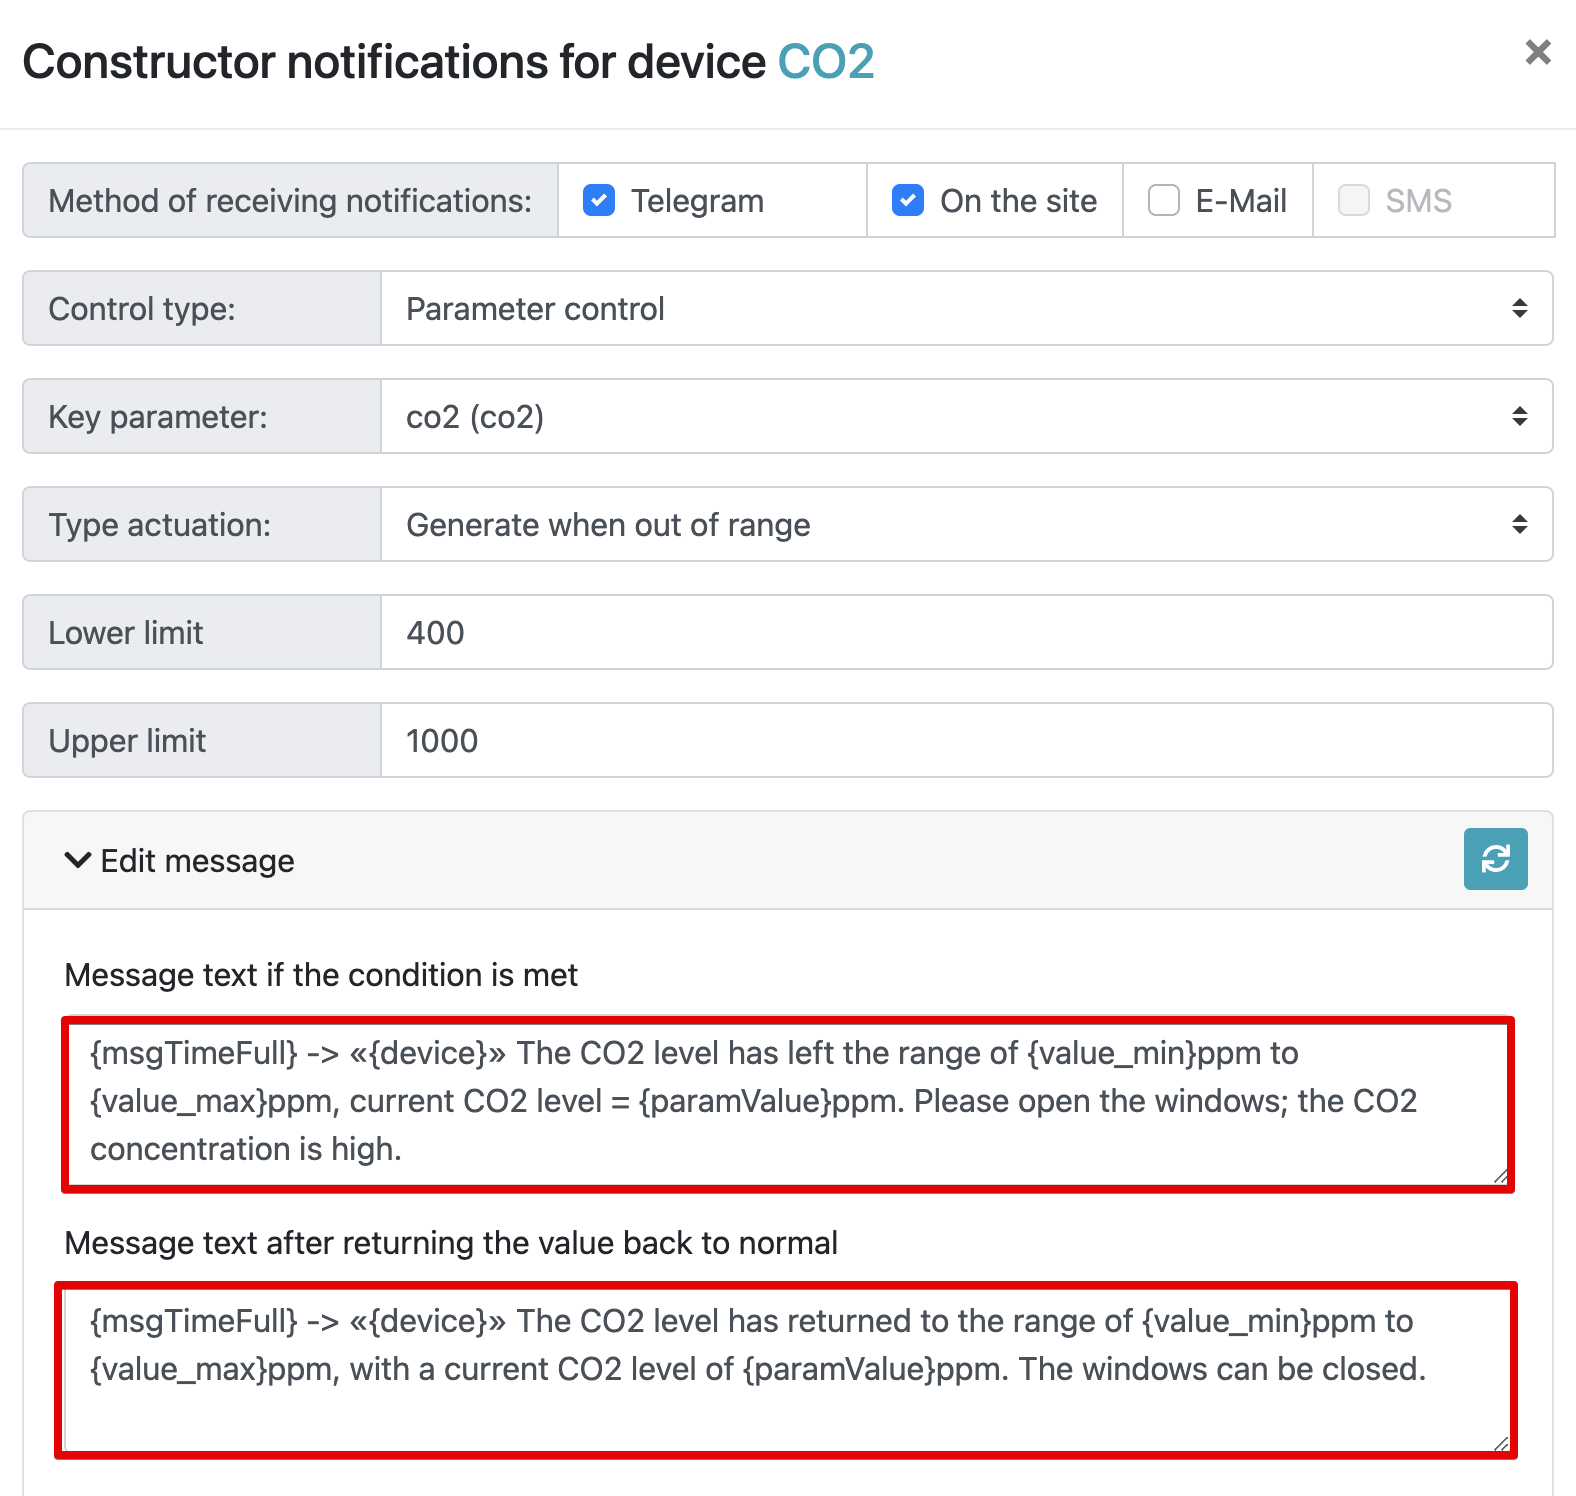
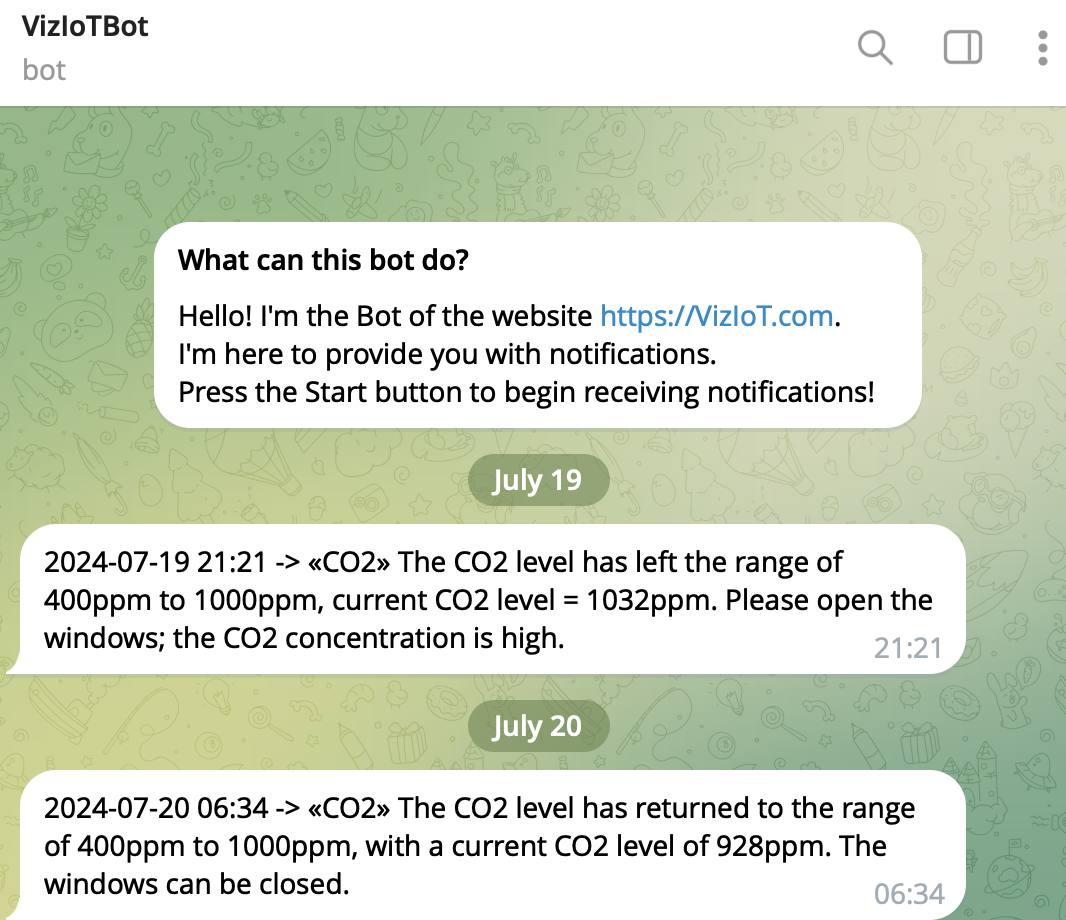
Notifications
How to manage notifications and connect to the VizIoT Telegram Bot is discussed in the article VizIoT Notifications. In this section, we will look at setting up a custom message about permissible CO2 levels and alerts about high carbon dioxide concentration.
Create methods for receiving messages via Telegram bot and VizIoT website in the notification constructor, as shown in the screenshot.
Conclusion
Connecting the MH-Z19B sensor and SIM800L module to Arduino Mega 2560 using the VizIoT platform is a simple and effective solution for CO2 monitoring. The main advantages of this approach include remote real-time monitoring via GSM network, making it ideal for smart homes, offices, and industrial premises. The VizIoT platform provides convenient data display and analysis, as well as the ability to set up notifications and charts for effective air quality control.
This solution can be useful for organizations and individuals aiming to improve indoor environment conditions and ensure safe and comfortable occupancy of people in the premises.