Remote Monitoring of Energy Consumption with the VizIoT Web Server
This article is useful in the field of critical infrastructure, where there is a need for autonomous power supply for vital devices, such as in medicine, as well as in various laboratories and stations requiring uninterrupted operation of units and devices.
Introduction
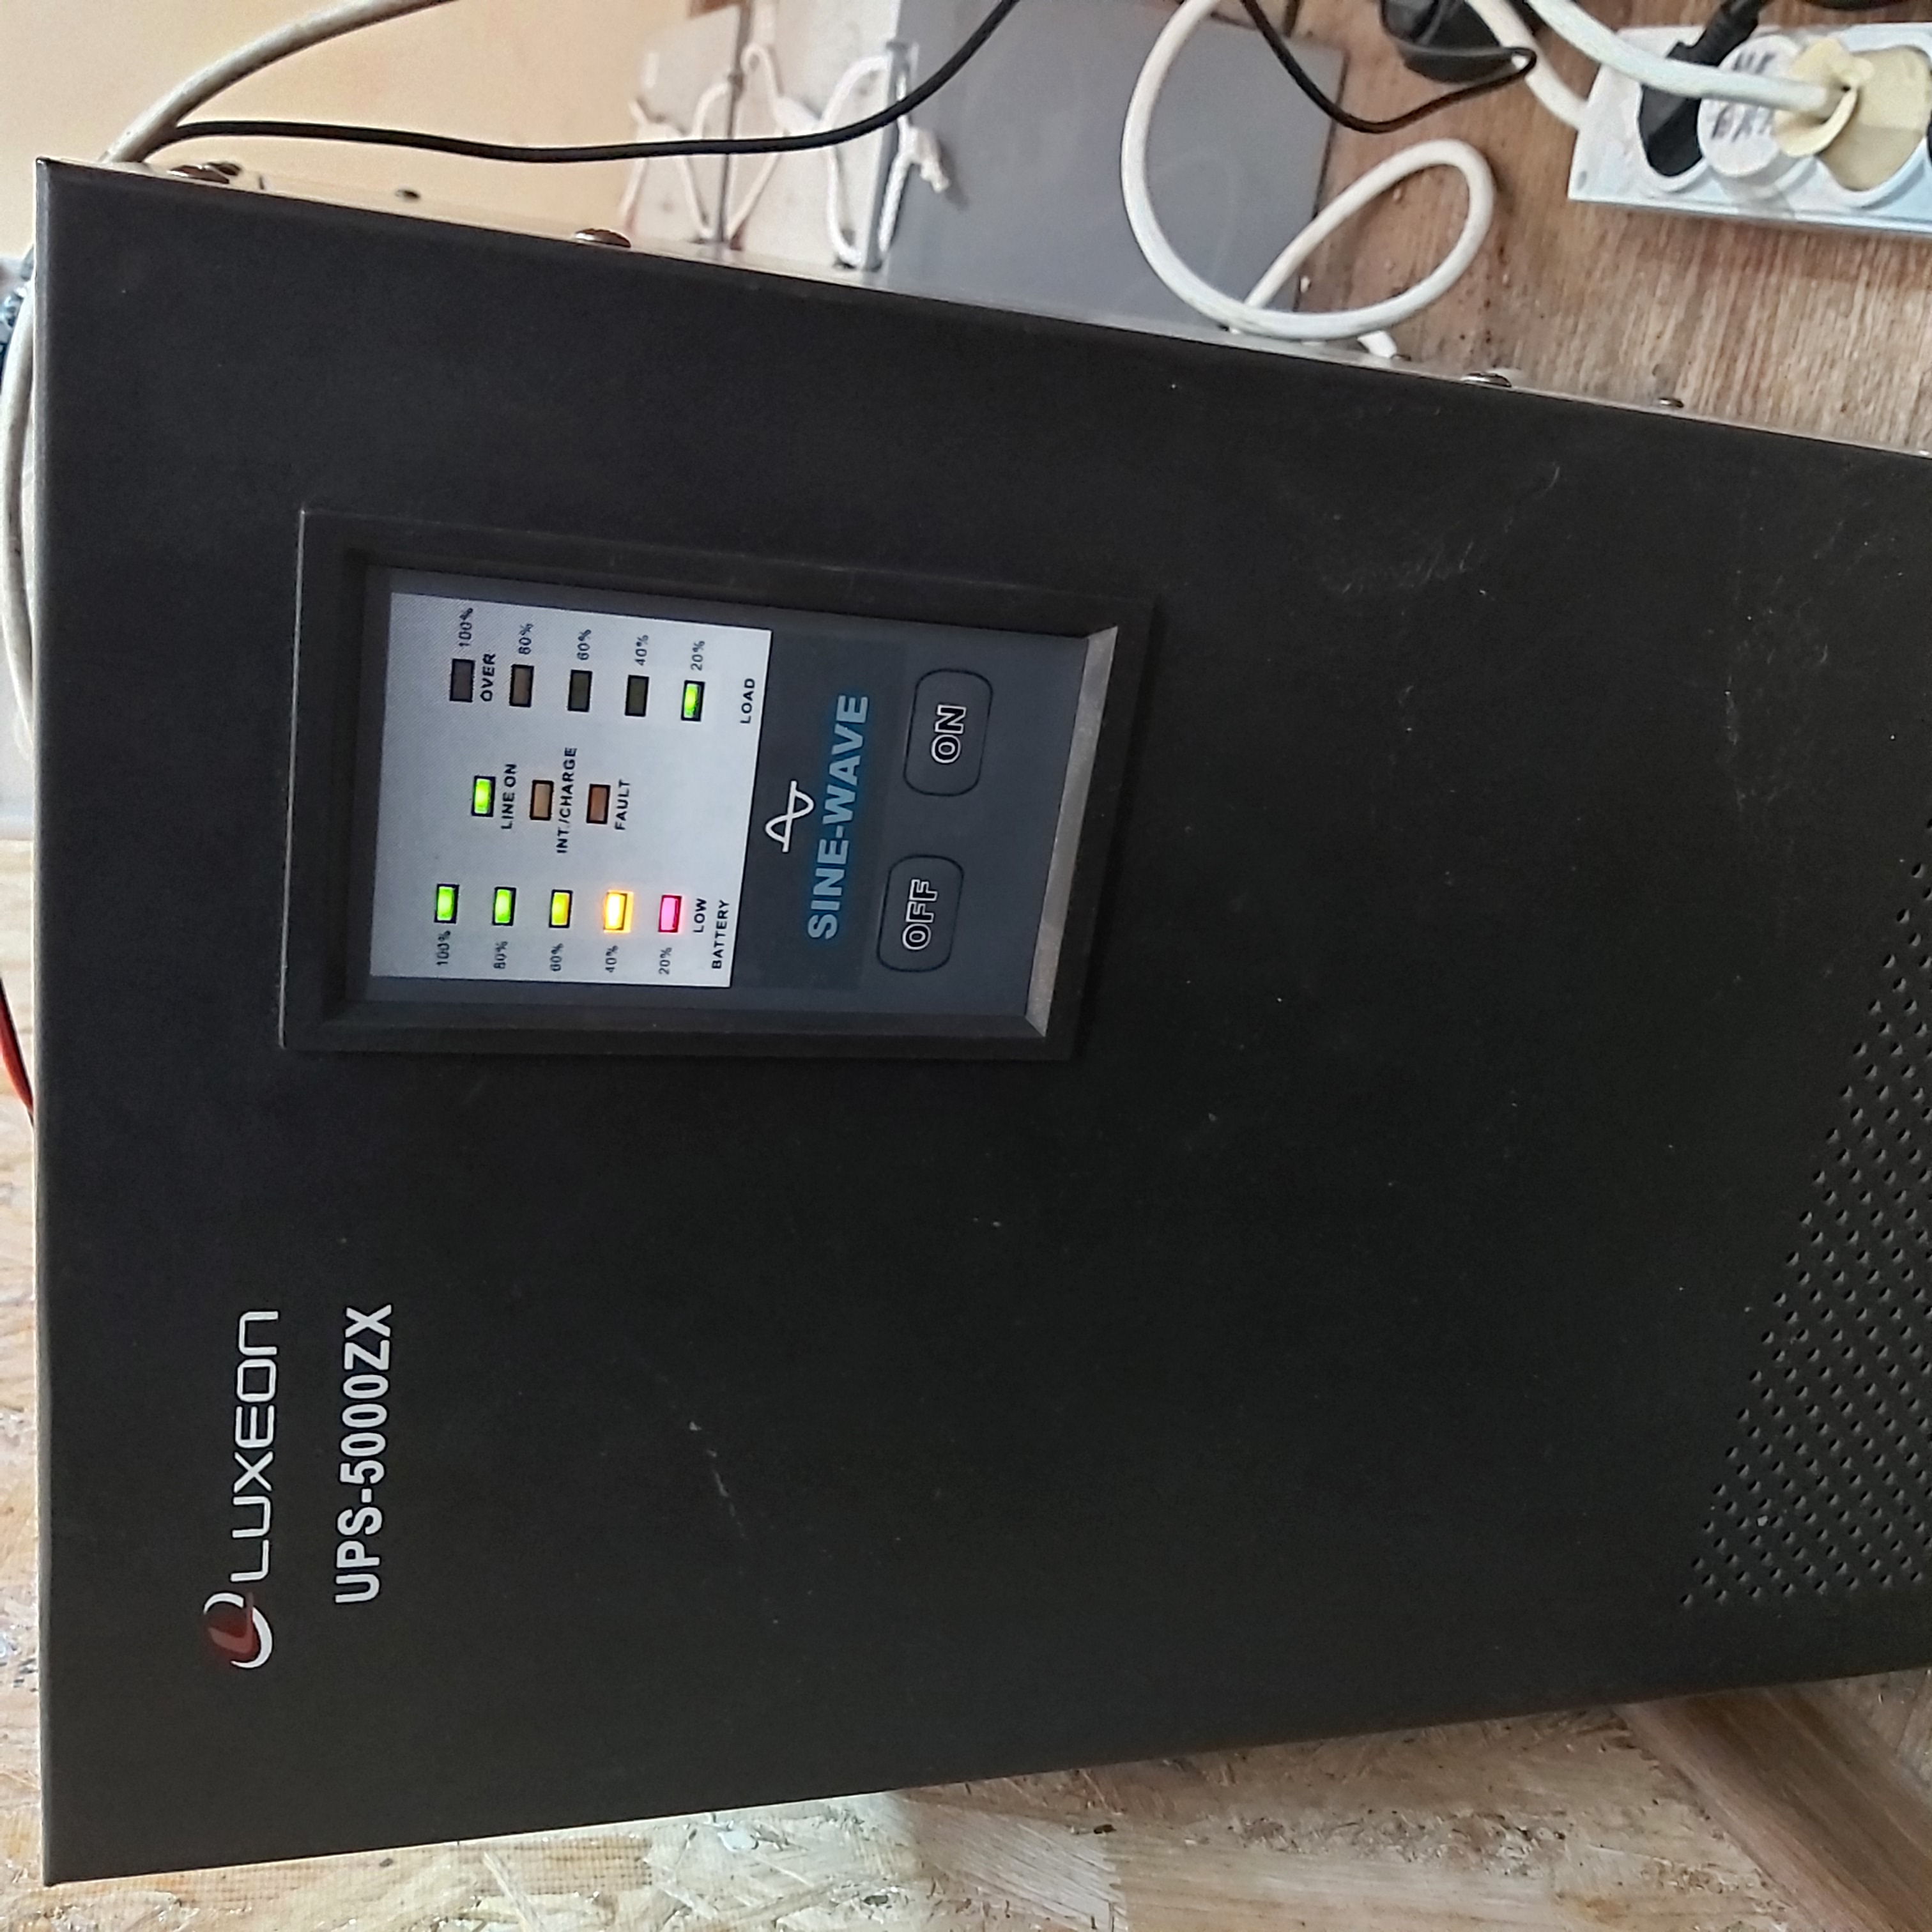
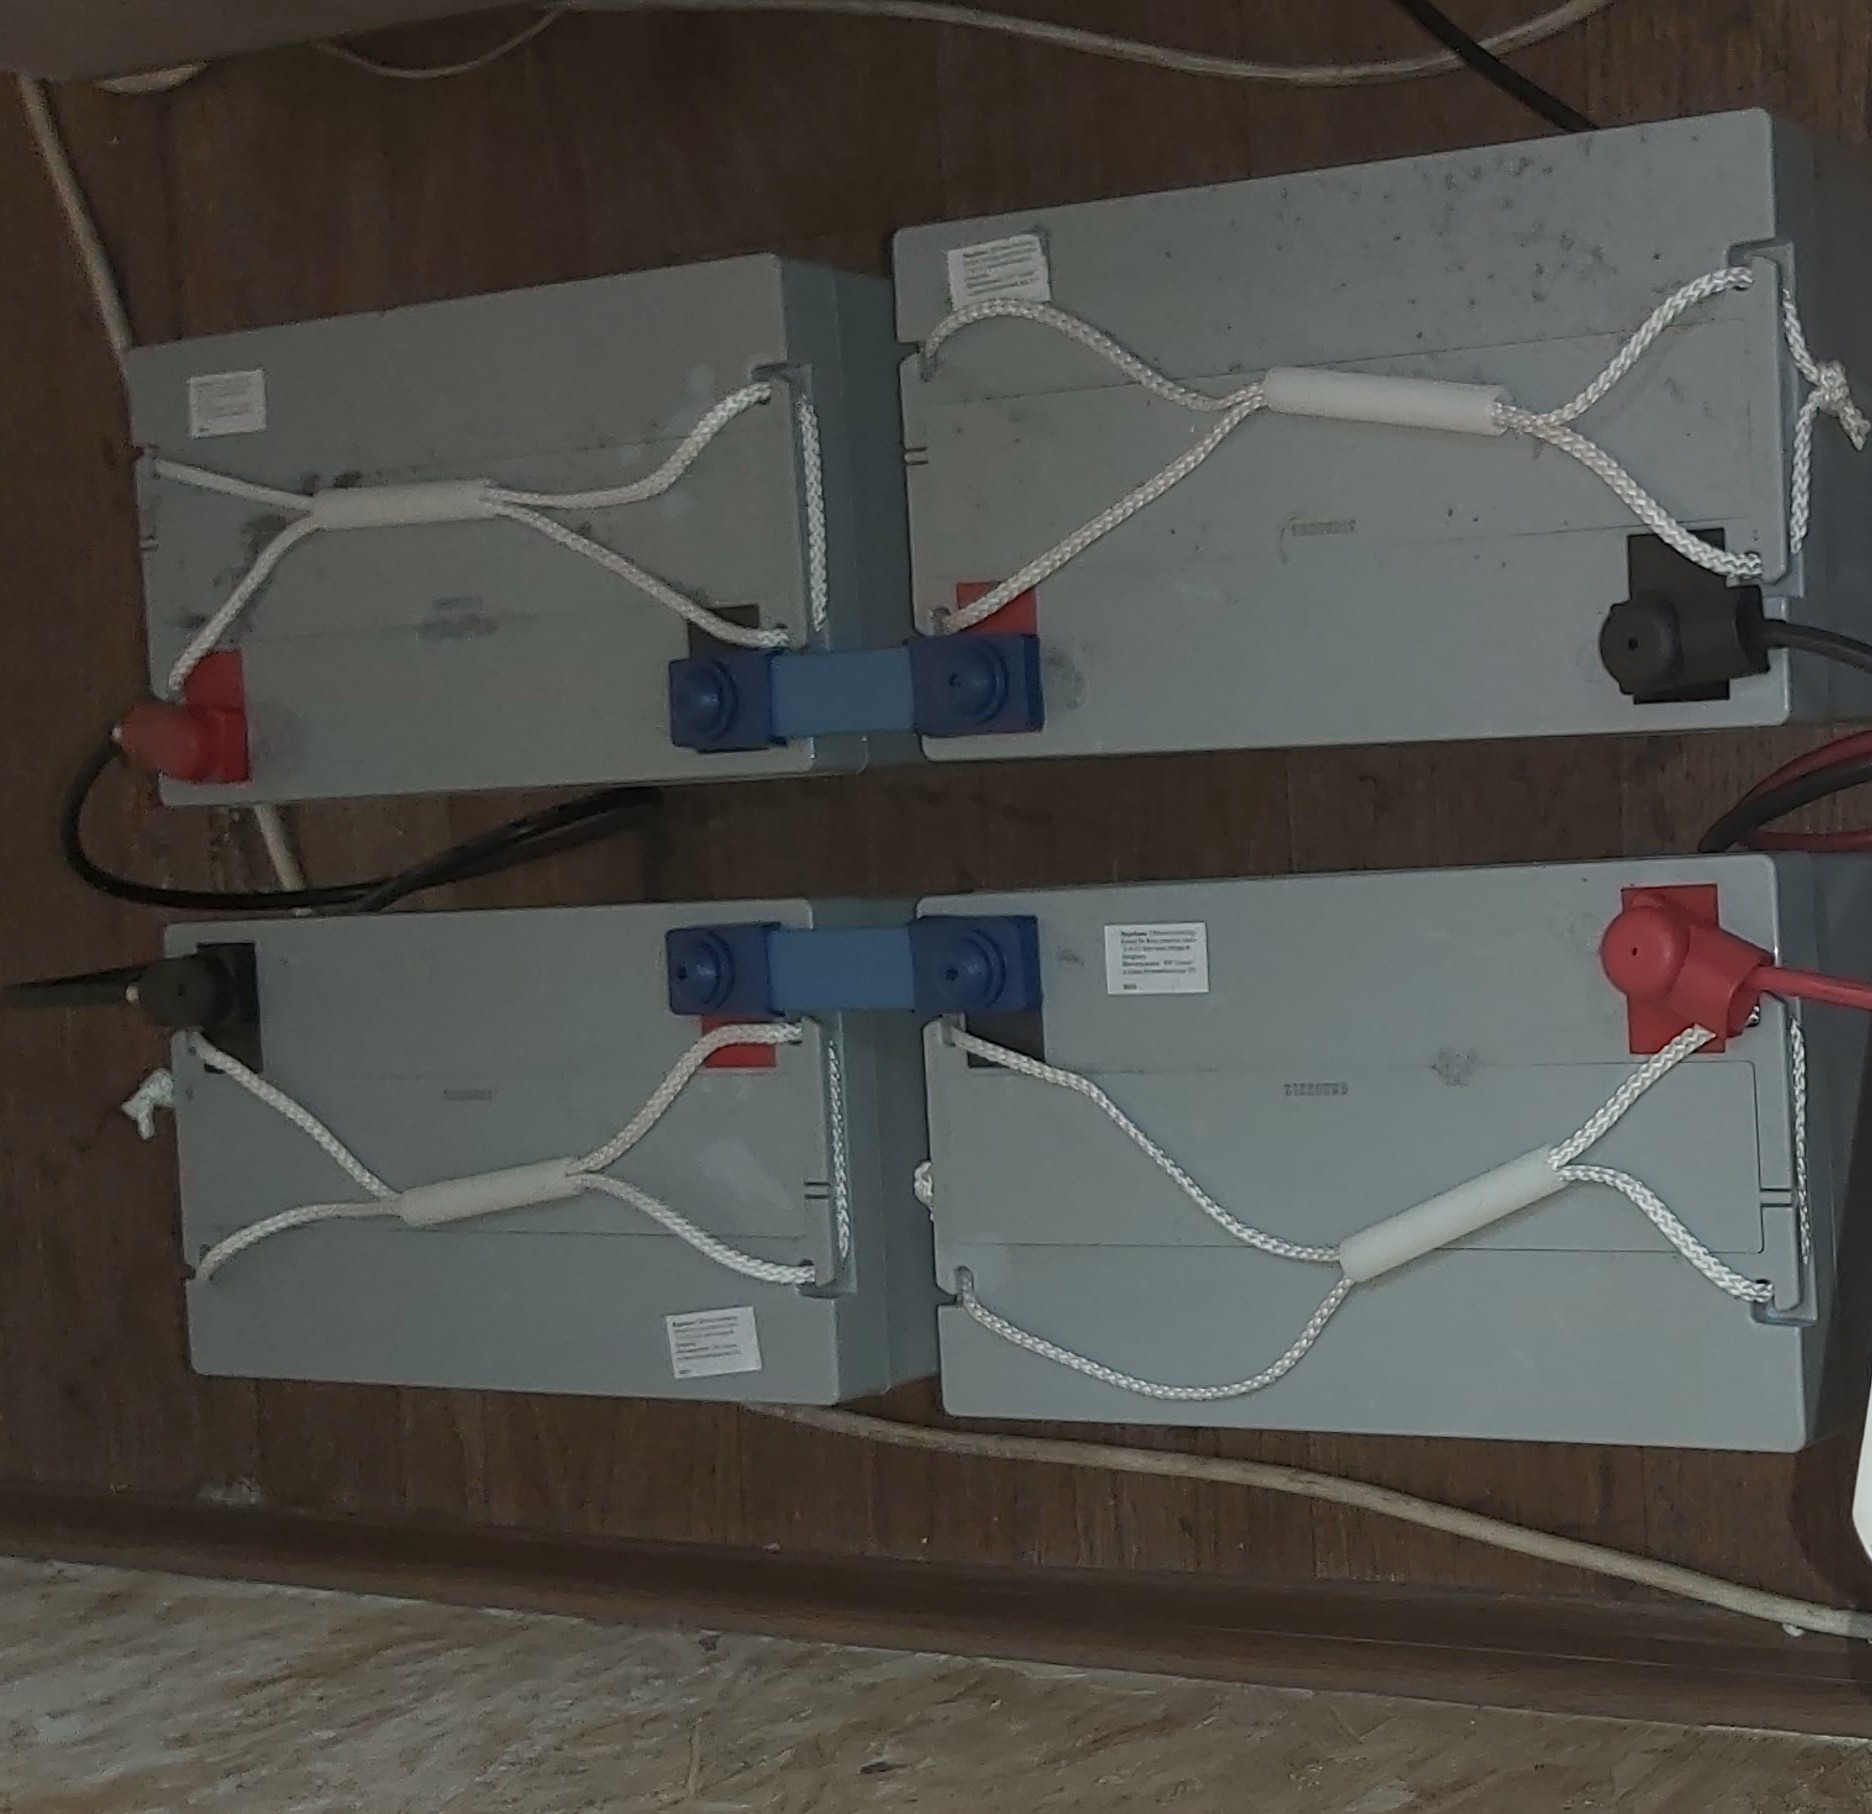
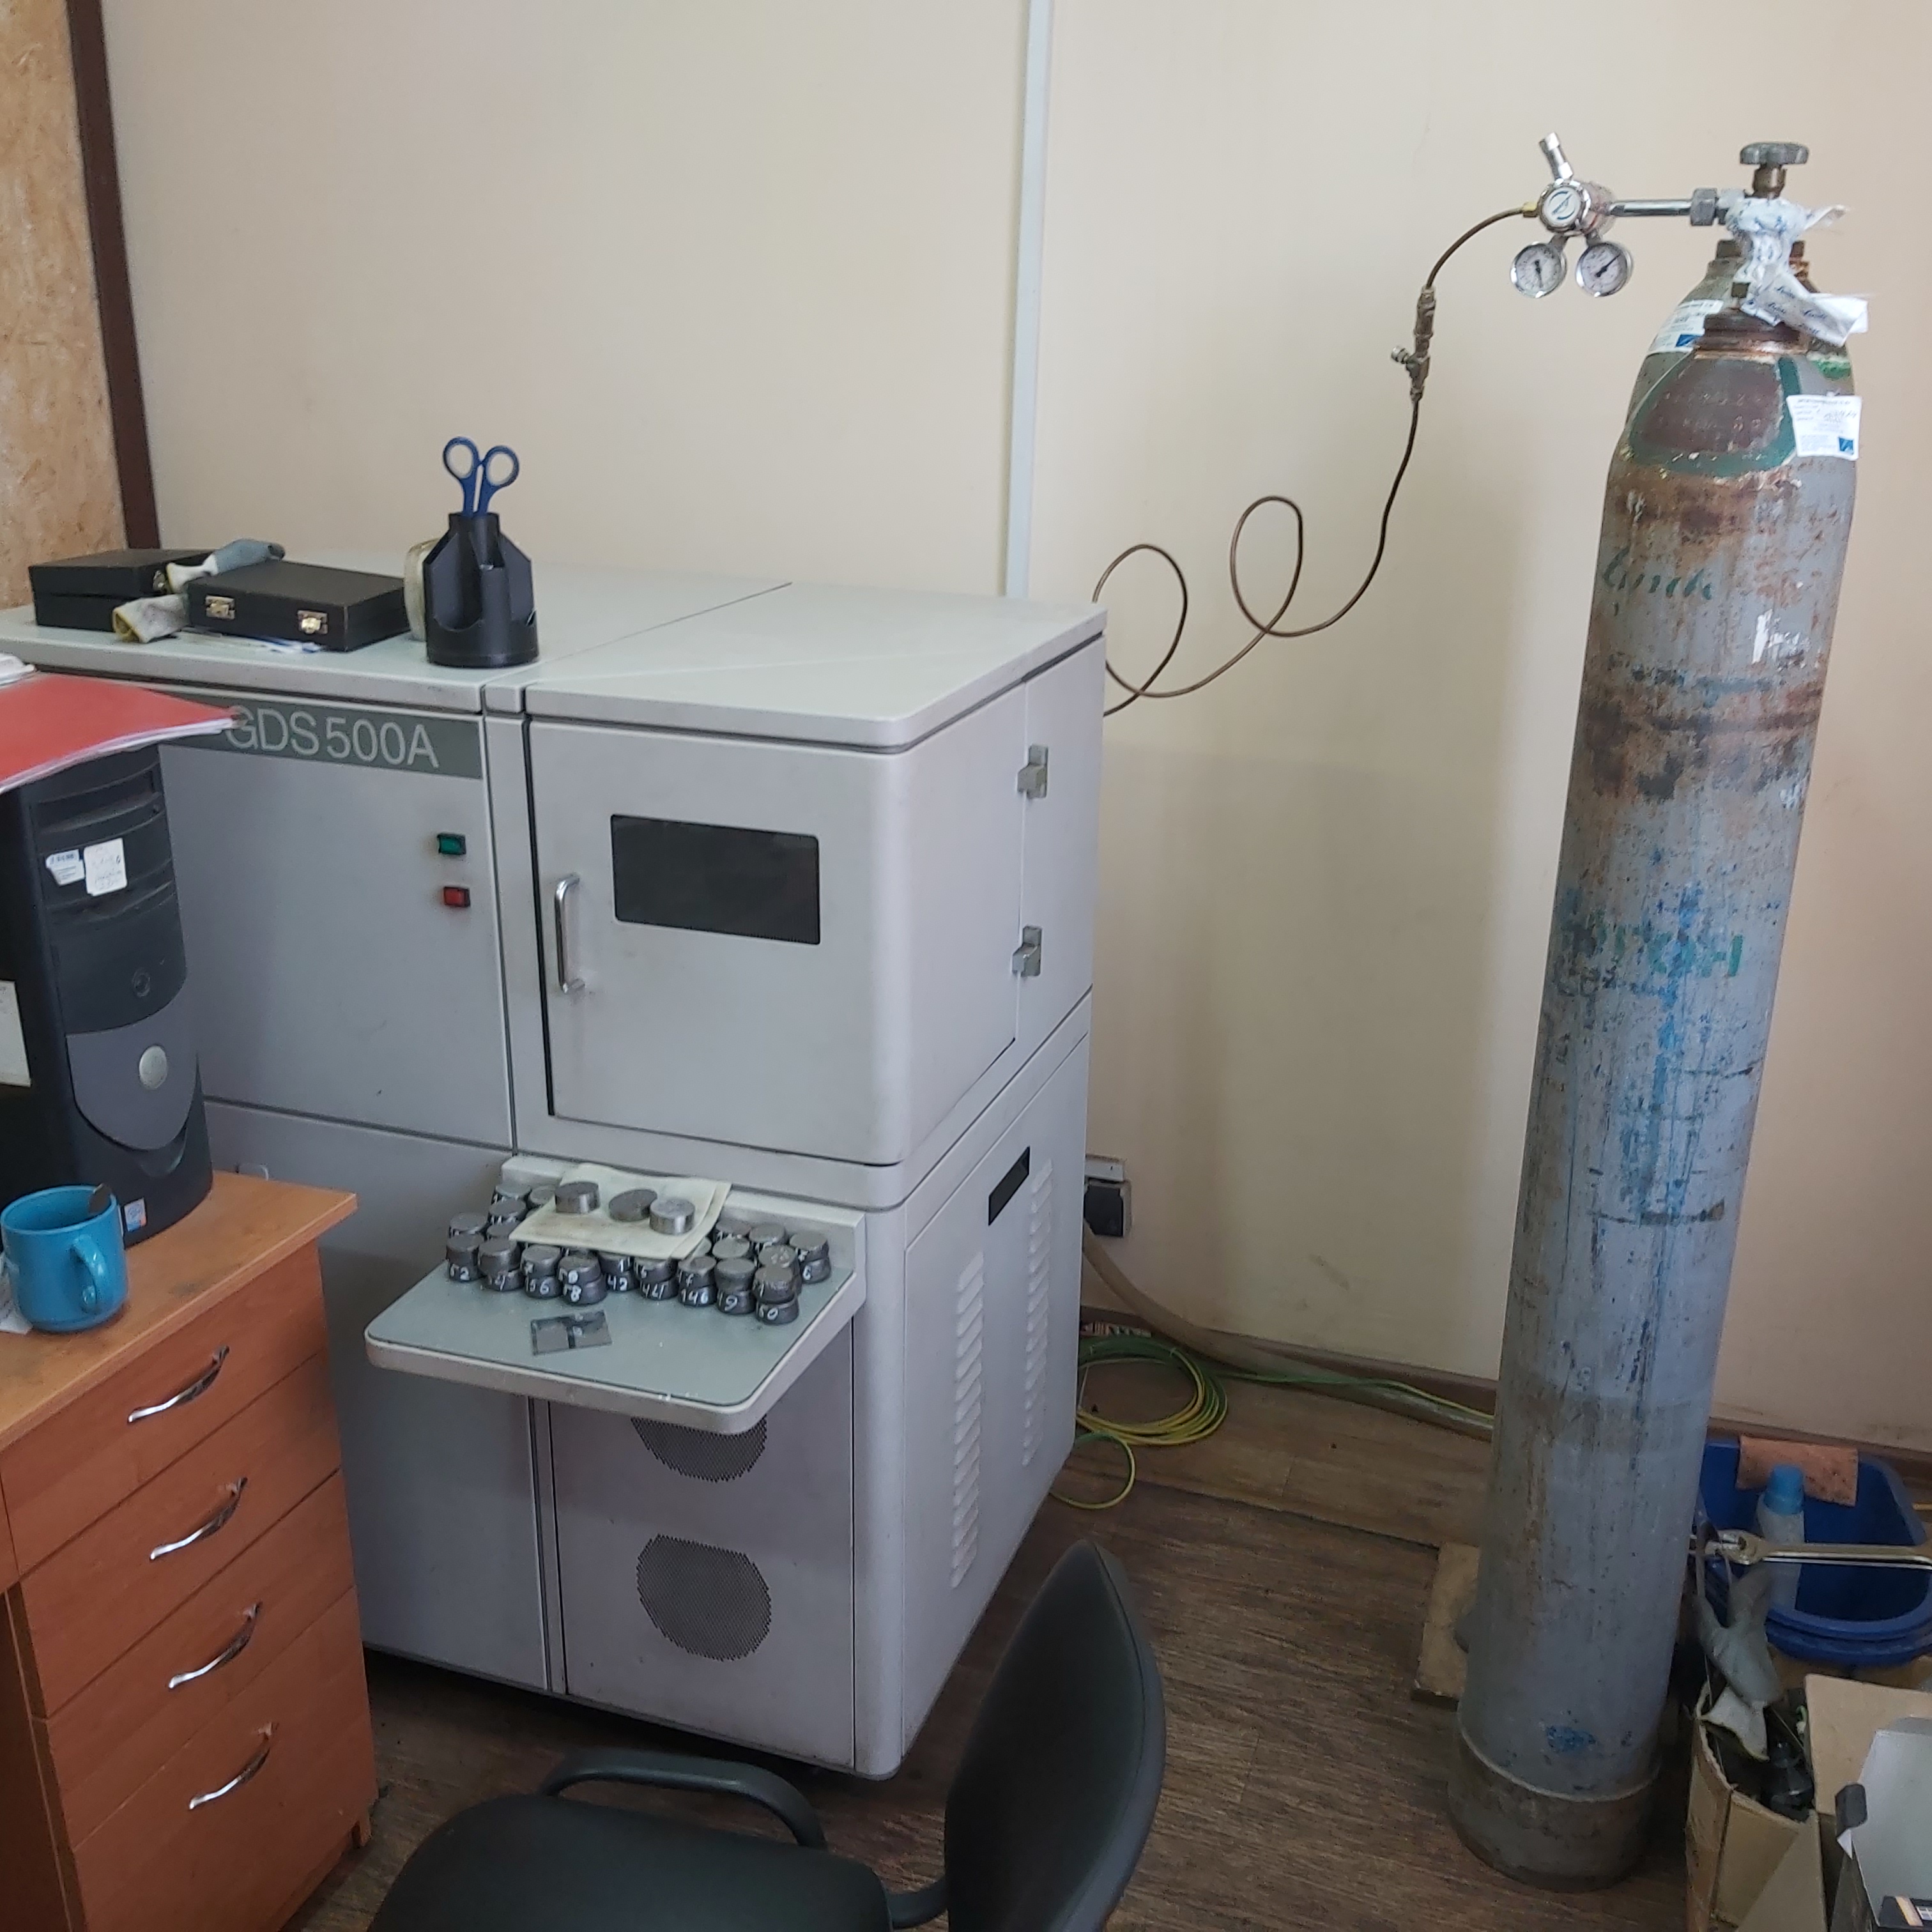
The object of this article is the LECO GDS-500A Atomic Emission Spectrometer, which was located in a laboratory at a steel plant. This spectrometer is connected to a Luxeon UPS - 5000 ZX uninterruptible power supply, which provides timely autonomous power to the spectrometer.
Monitoring Energy Consumption and the Advantages of Remote Control
The need for remote control was prompted by the following situation: upon arriving for their shift in the morning, laboratory staff discovered that the spectrometer was turned off. They contacted the developers of the VizIoT website to determine the cause of the shutdown. Possible failure factors included:
- Prolonged power outage.
- Battery issues.
- UPS problems.
- Spectrometer malfunction.
To identify the cause, it was decided to connect a load meter to the 220V uninterruptible power supply using the well-known and proven VizIoT web resource.
How this monitoring system works can be explored in the following publications:
- Connecting a BME280 Sensor to an ESP8266 and Creating a Weather Station with VizIoT
- Remote Control of ESP8266
- VizIoT Notifications, where the operation of the web server for remote management and equipment monitoring is described in detail and with physical examples.
In our project, we will use two devices: one for monitoring AC and another for monitoring DC. These devices will help us effectively track and analyze electrical parameters.
AC Monitoring
Device capabilities:
- Measurement of AC
- Voltage determination
- Recording data for further analysis
DC Monitoring
Device capabilities:
- Measurement of DC
- Voltage determination
- Recording data for further analysis
Devices for Monitoring
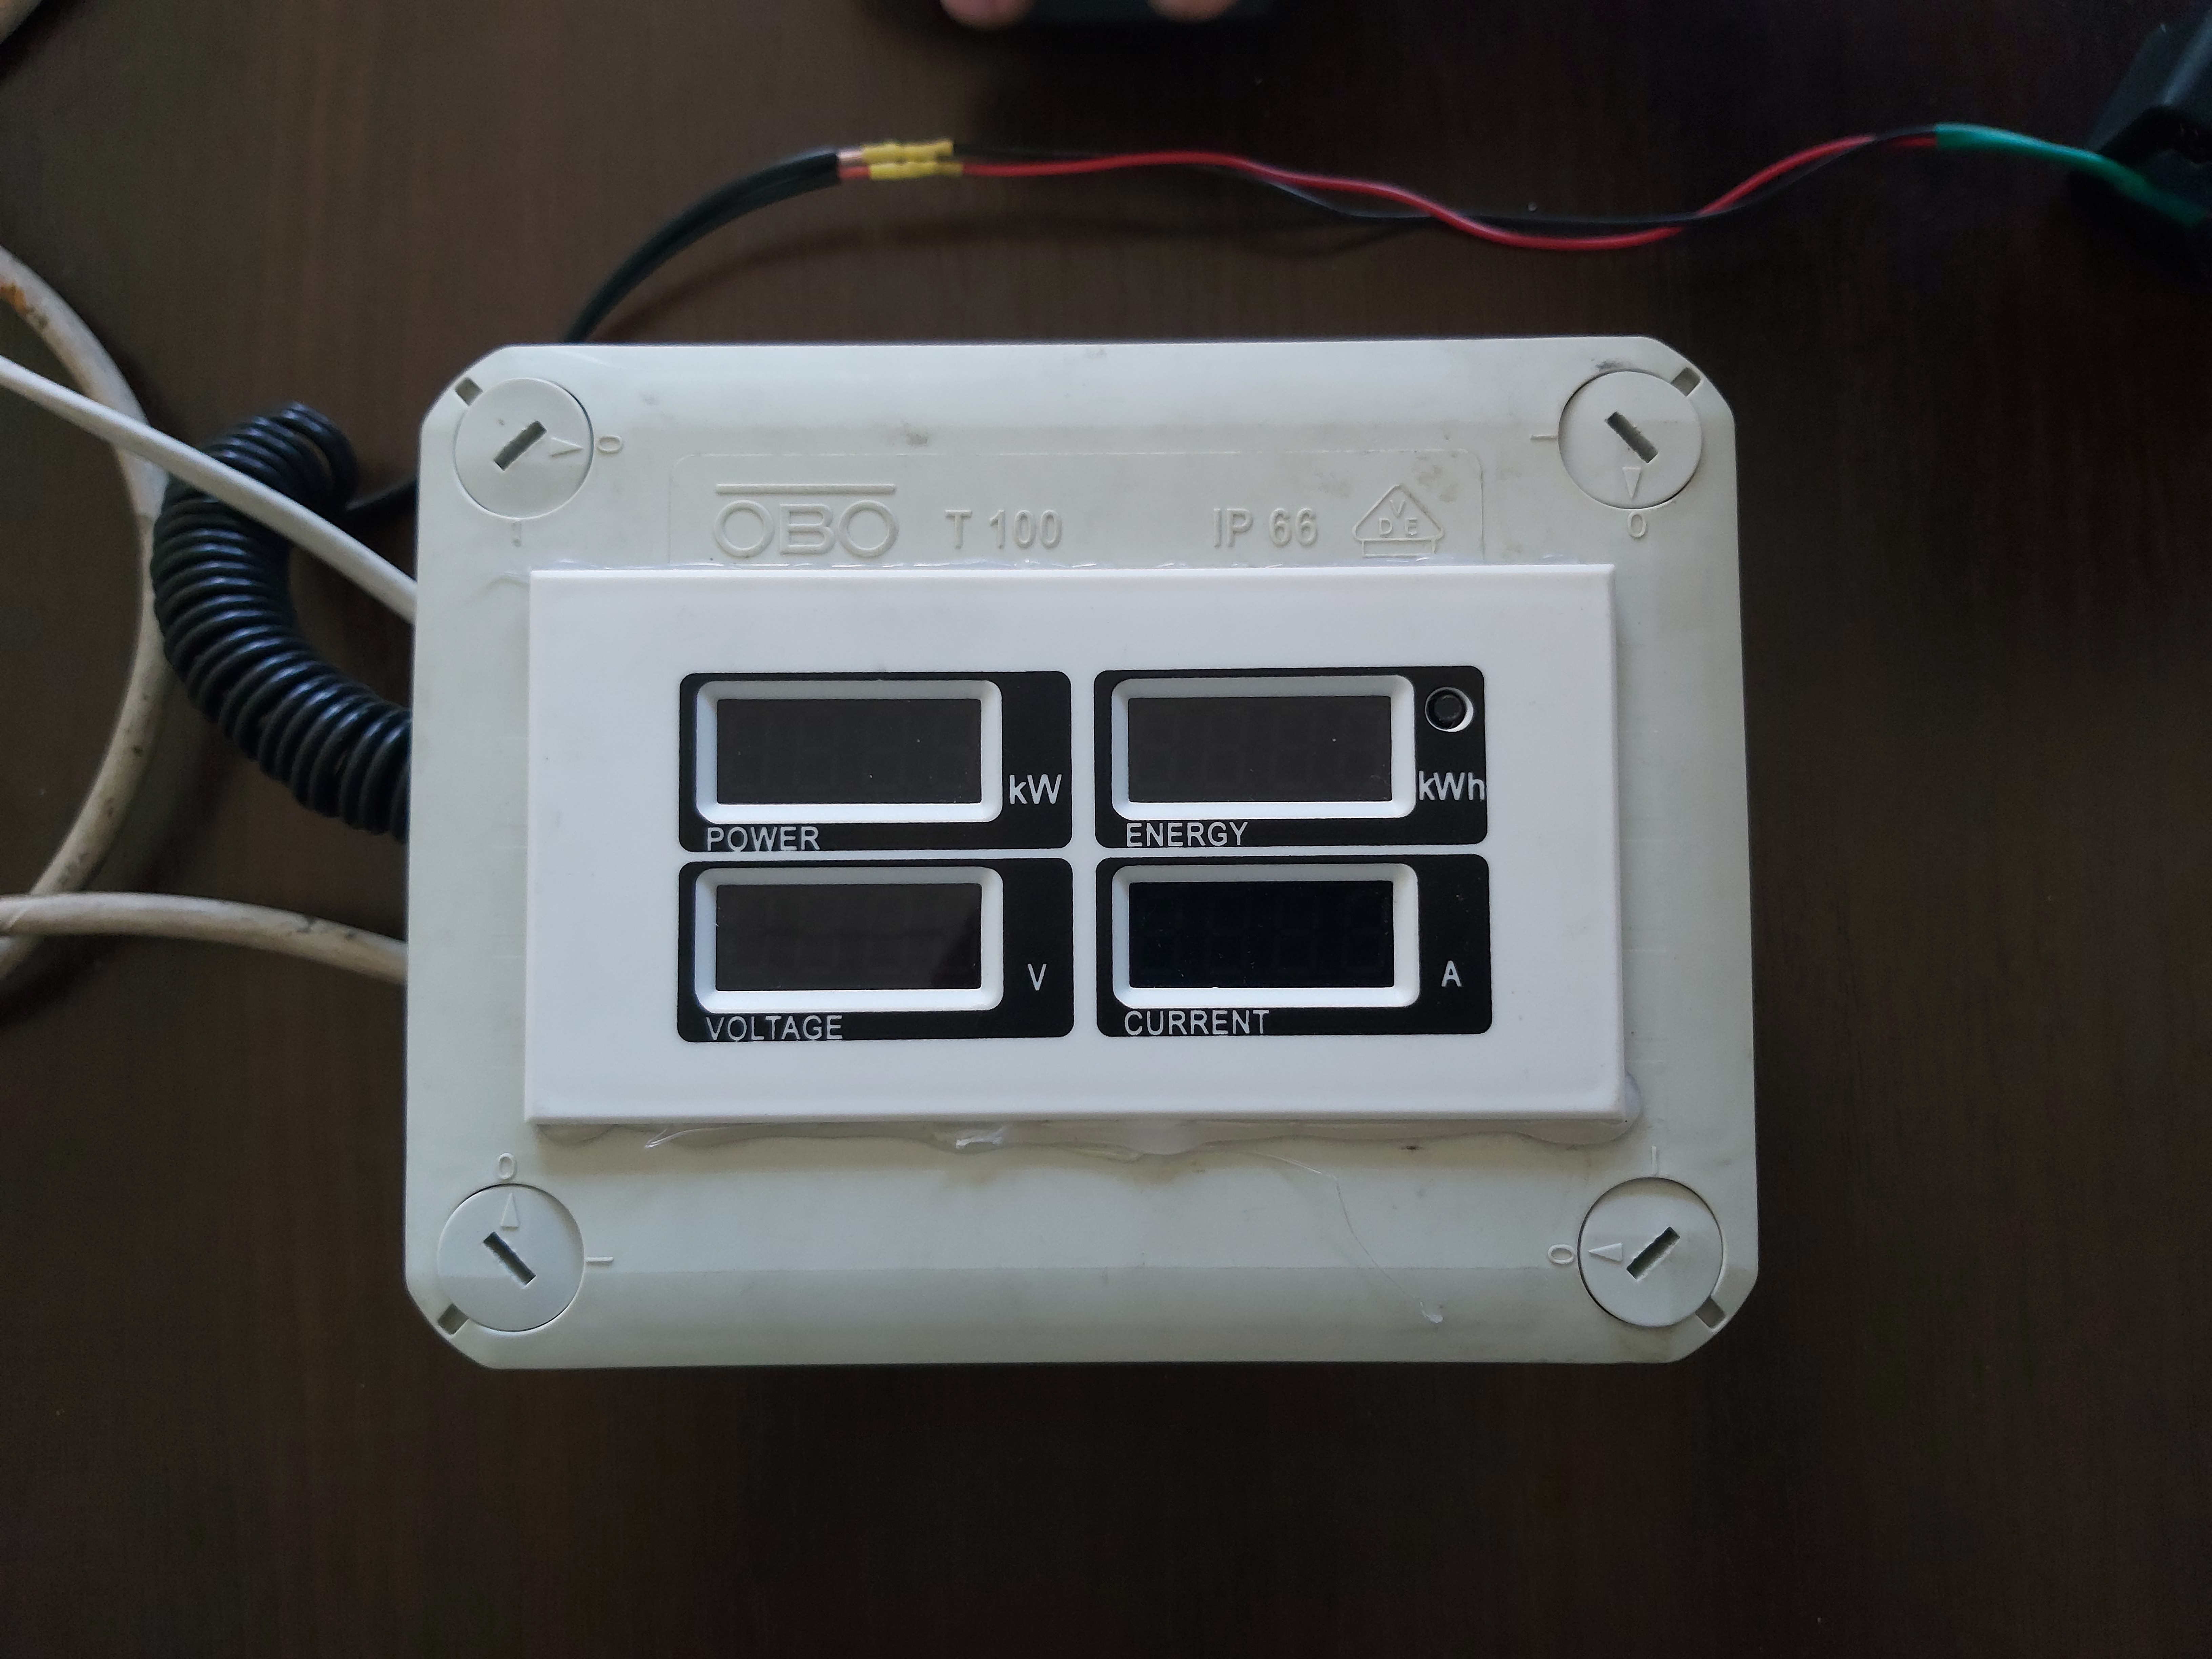
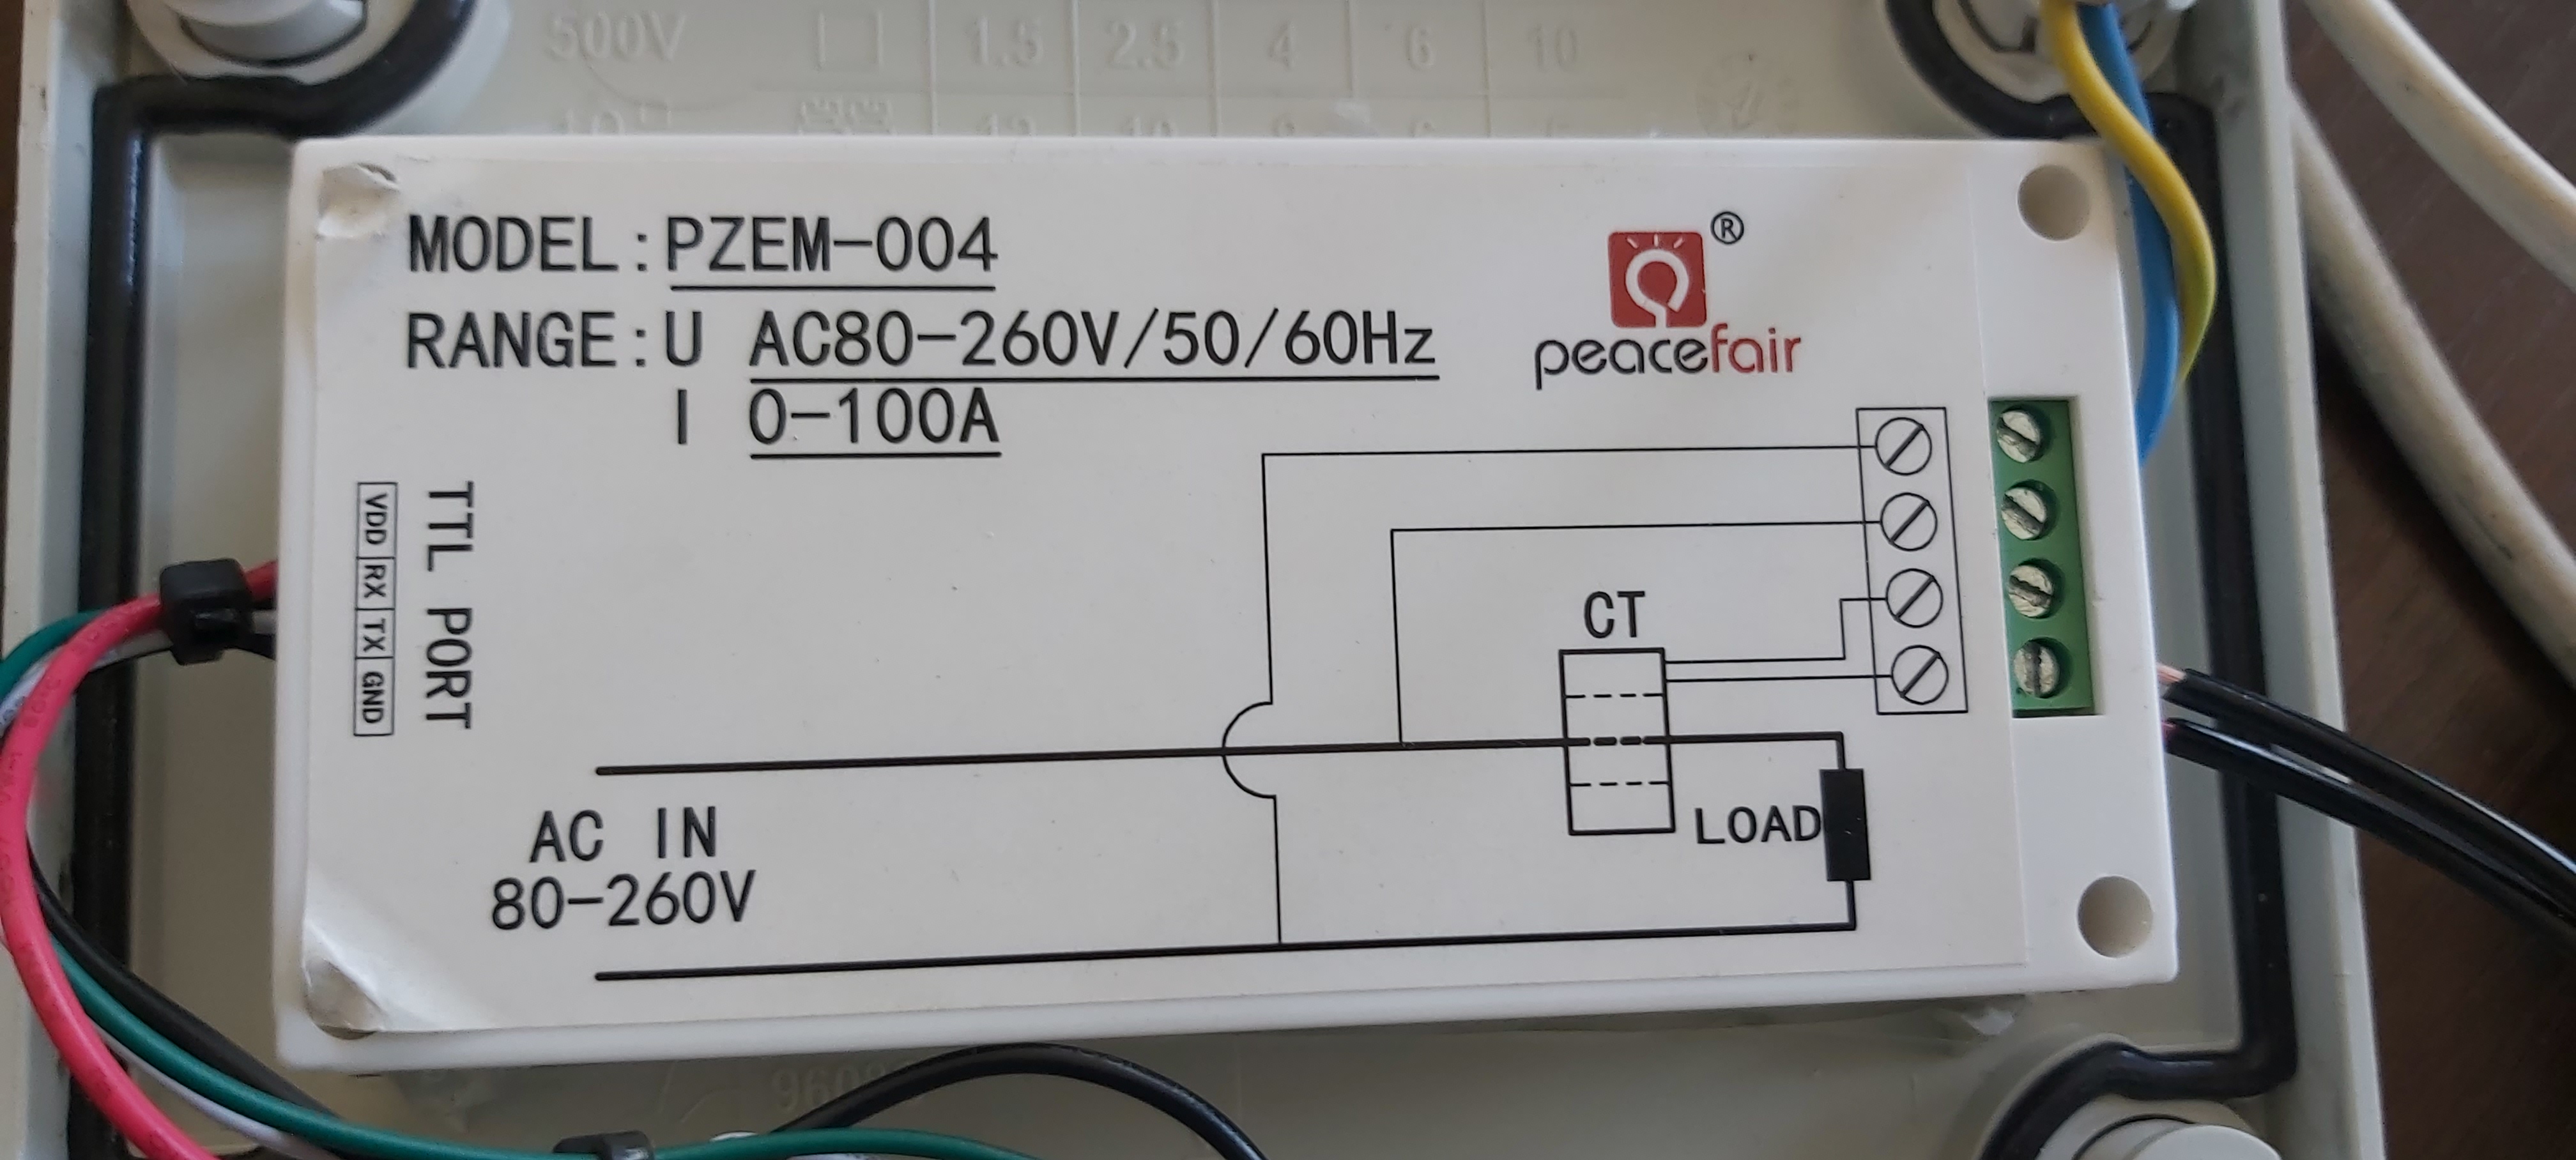
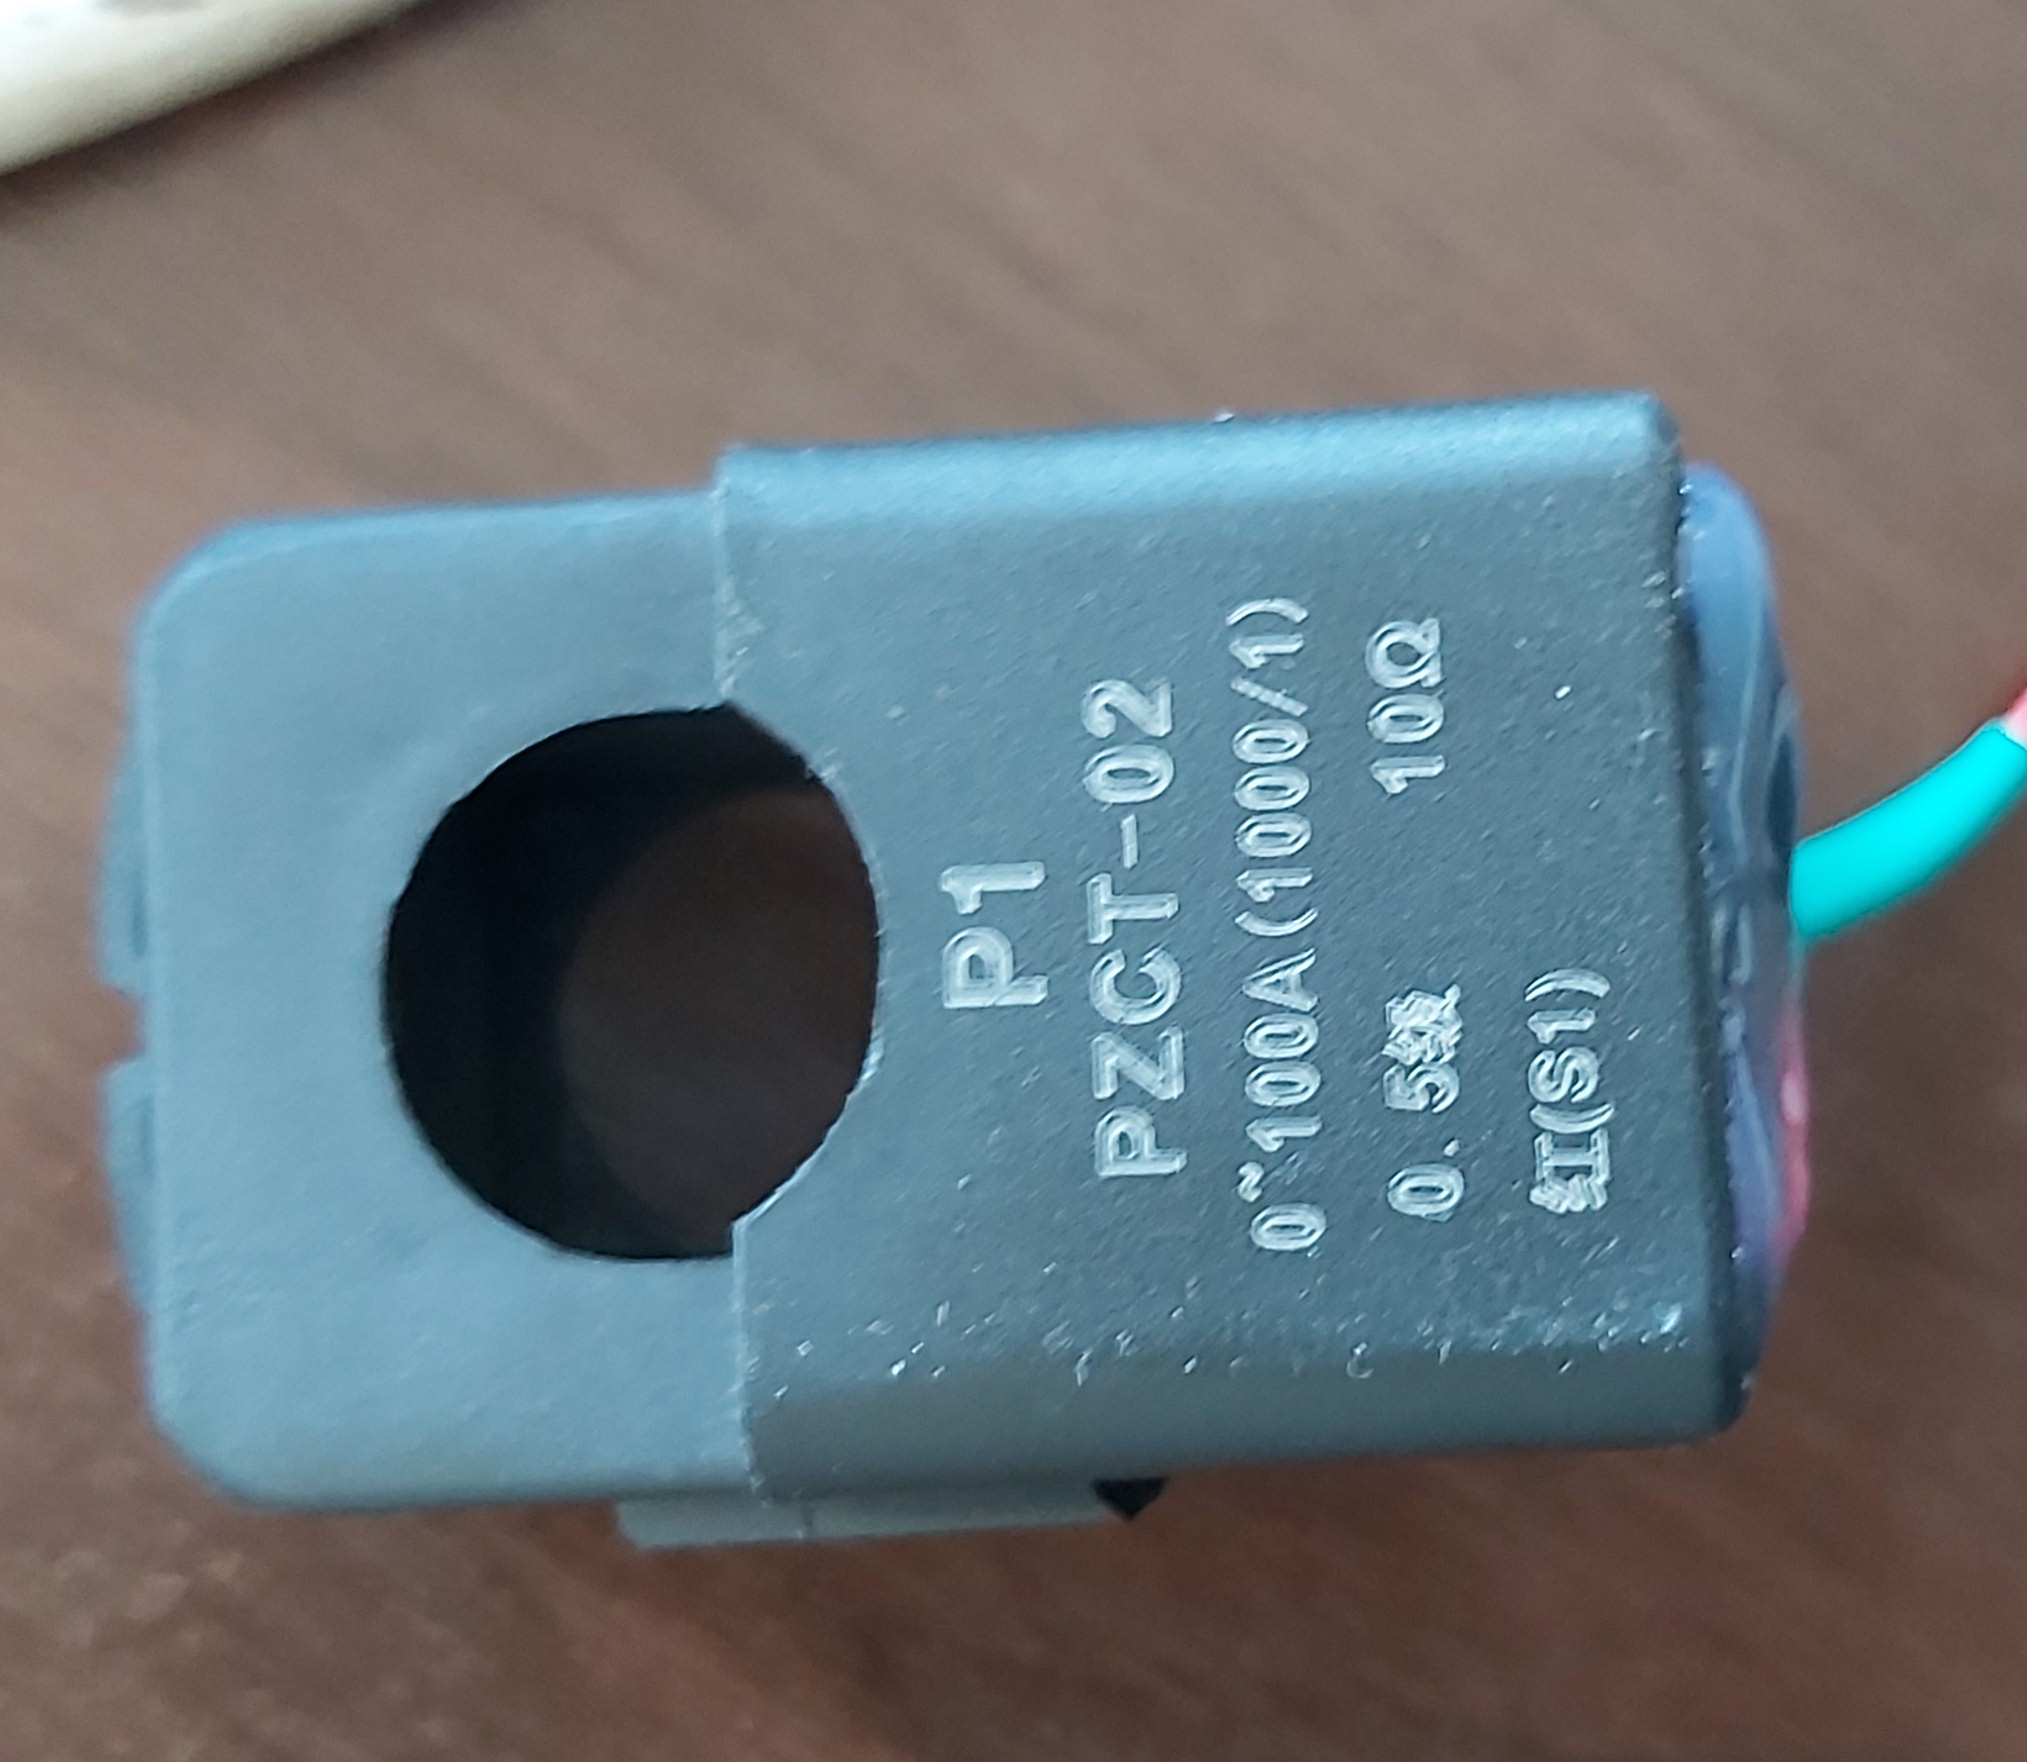
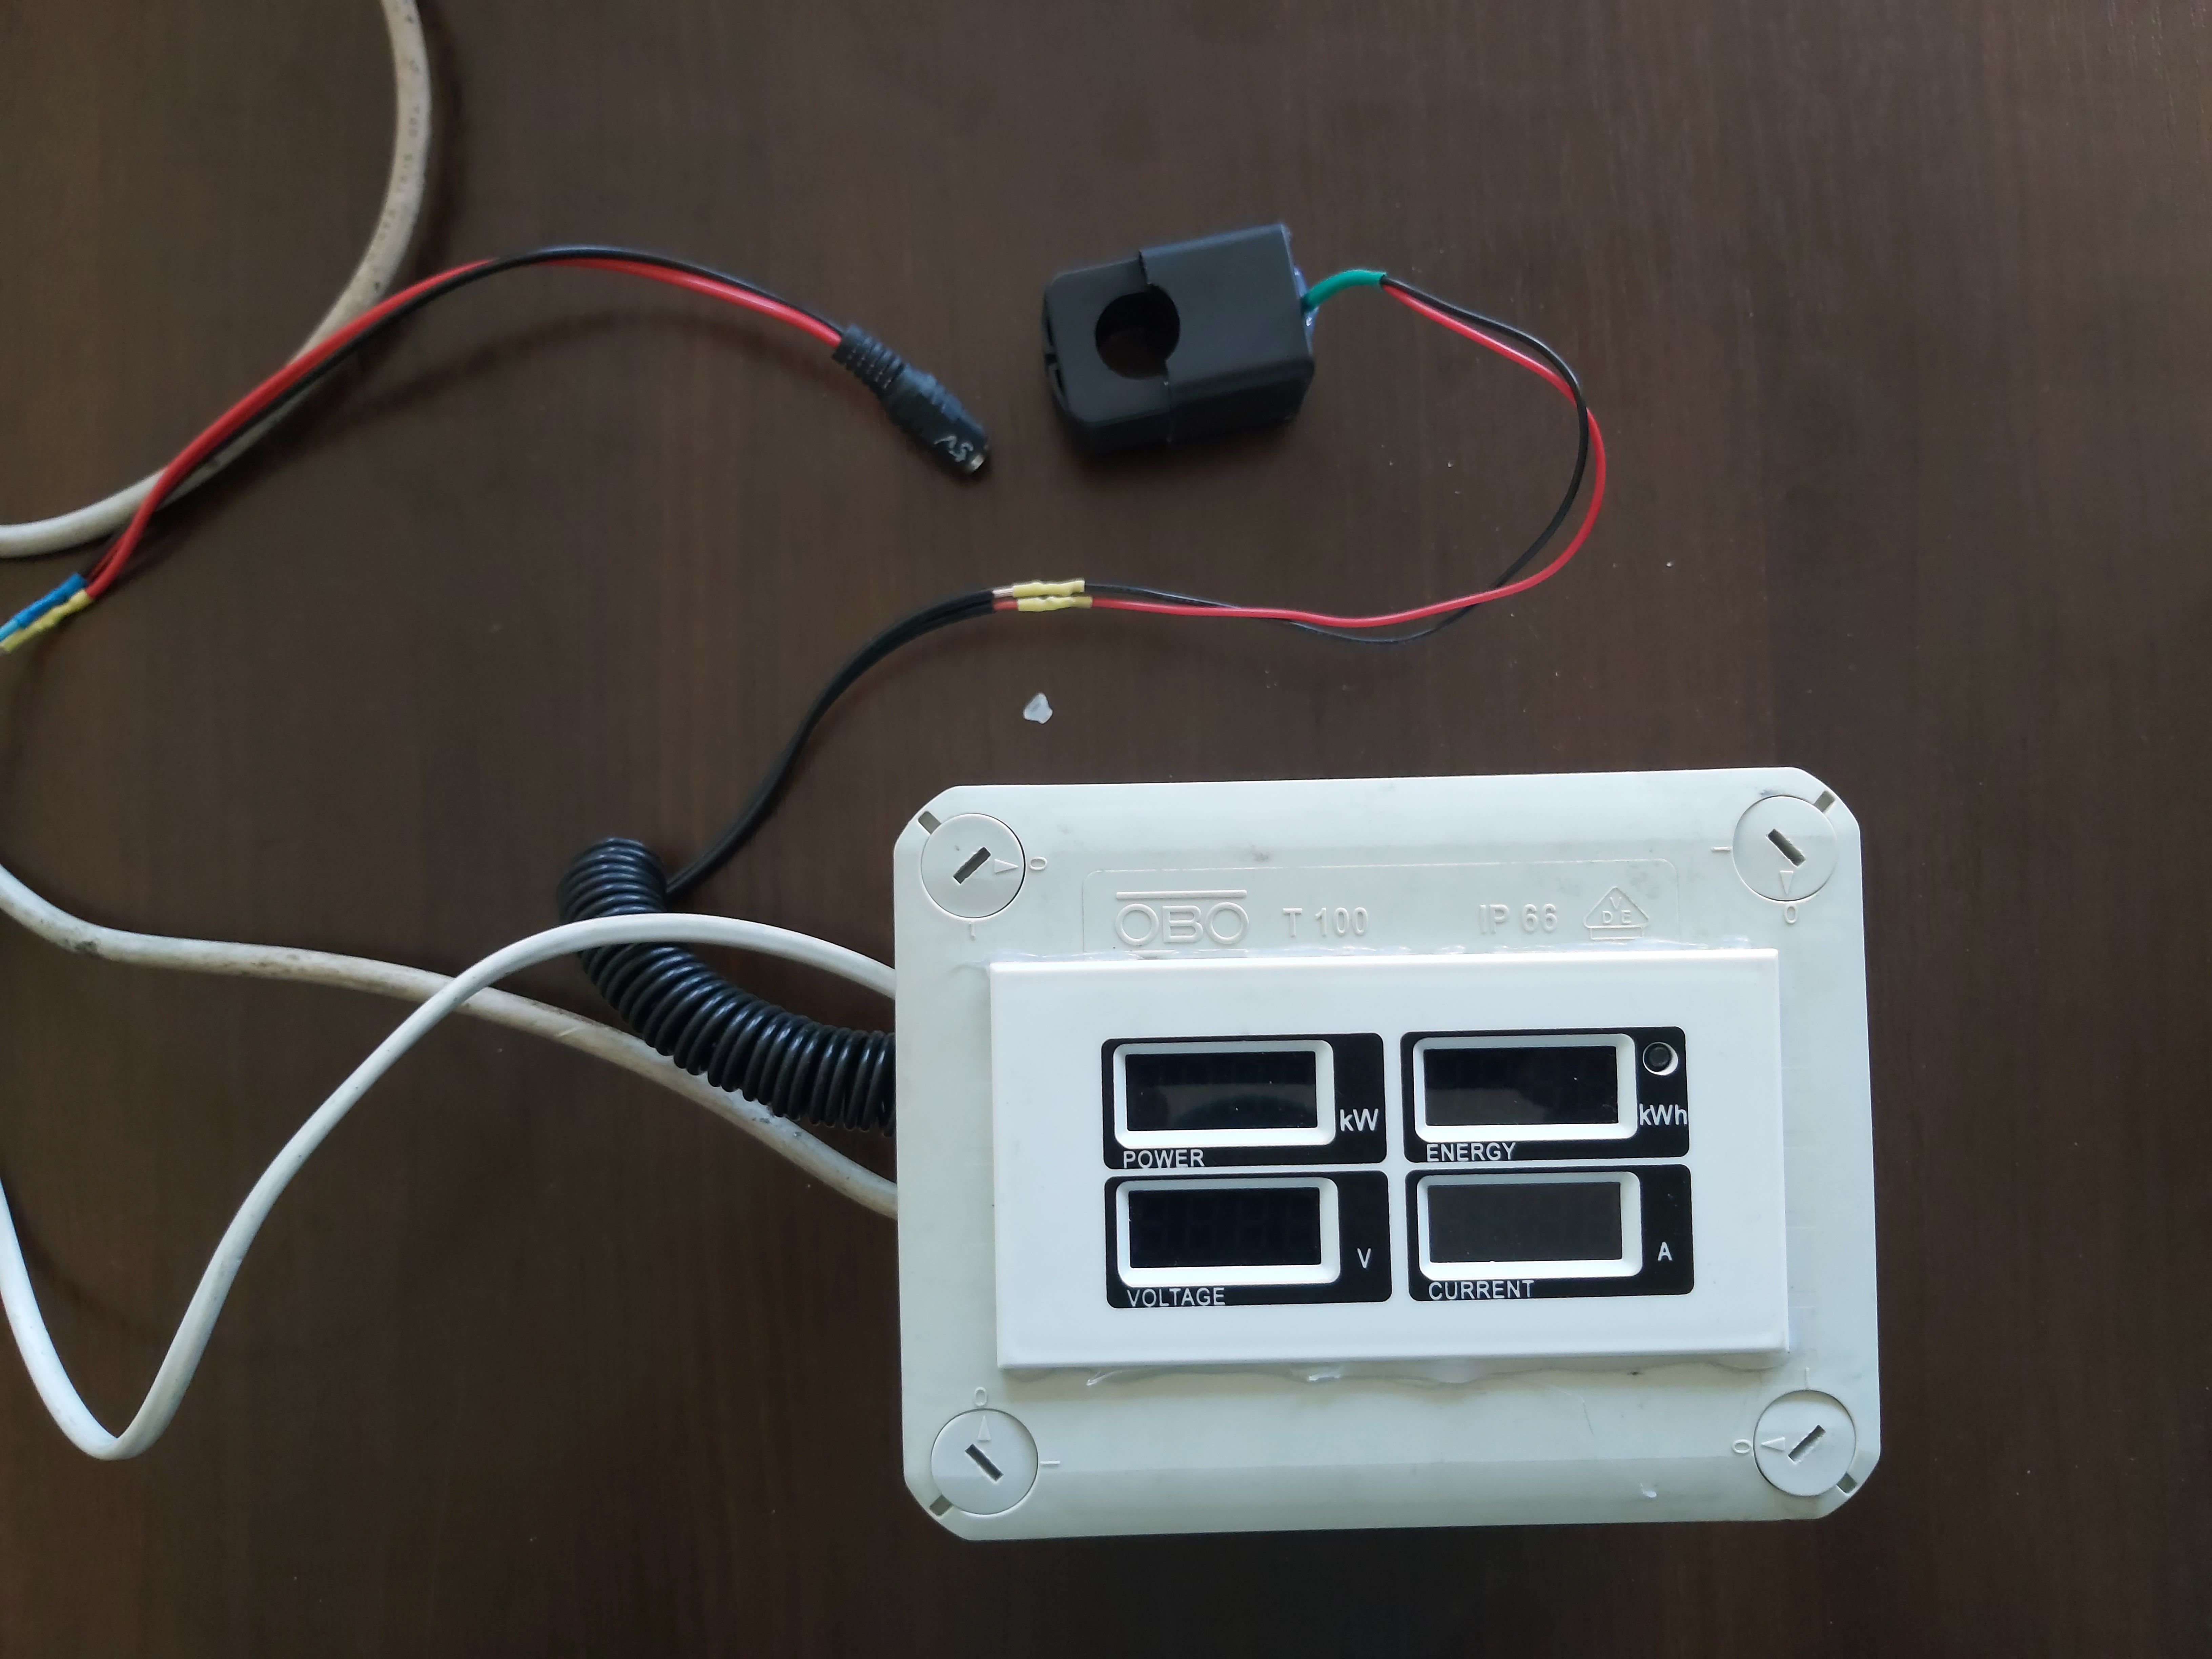
We will monitor energy consumption using the multifunctional electrical energy consumption meter PZEM-004 — a device for monitoring AC parameters that allows measuring various electrical parameters and providing data for analysis.
Connection to the electrical load
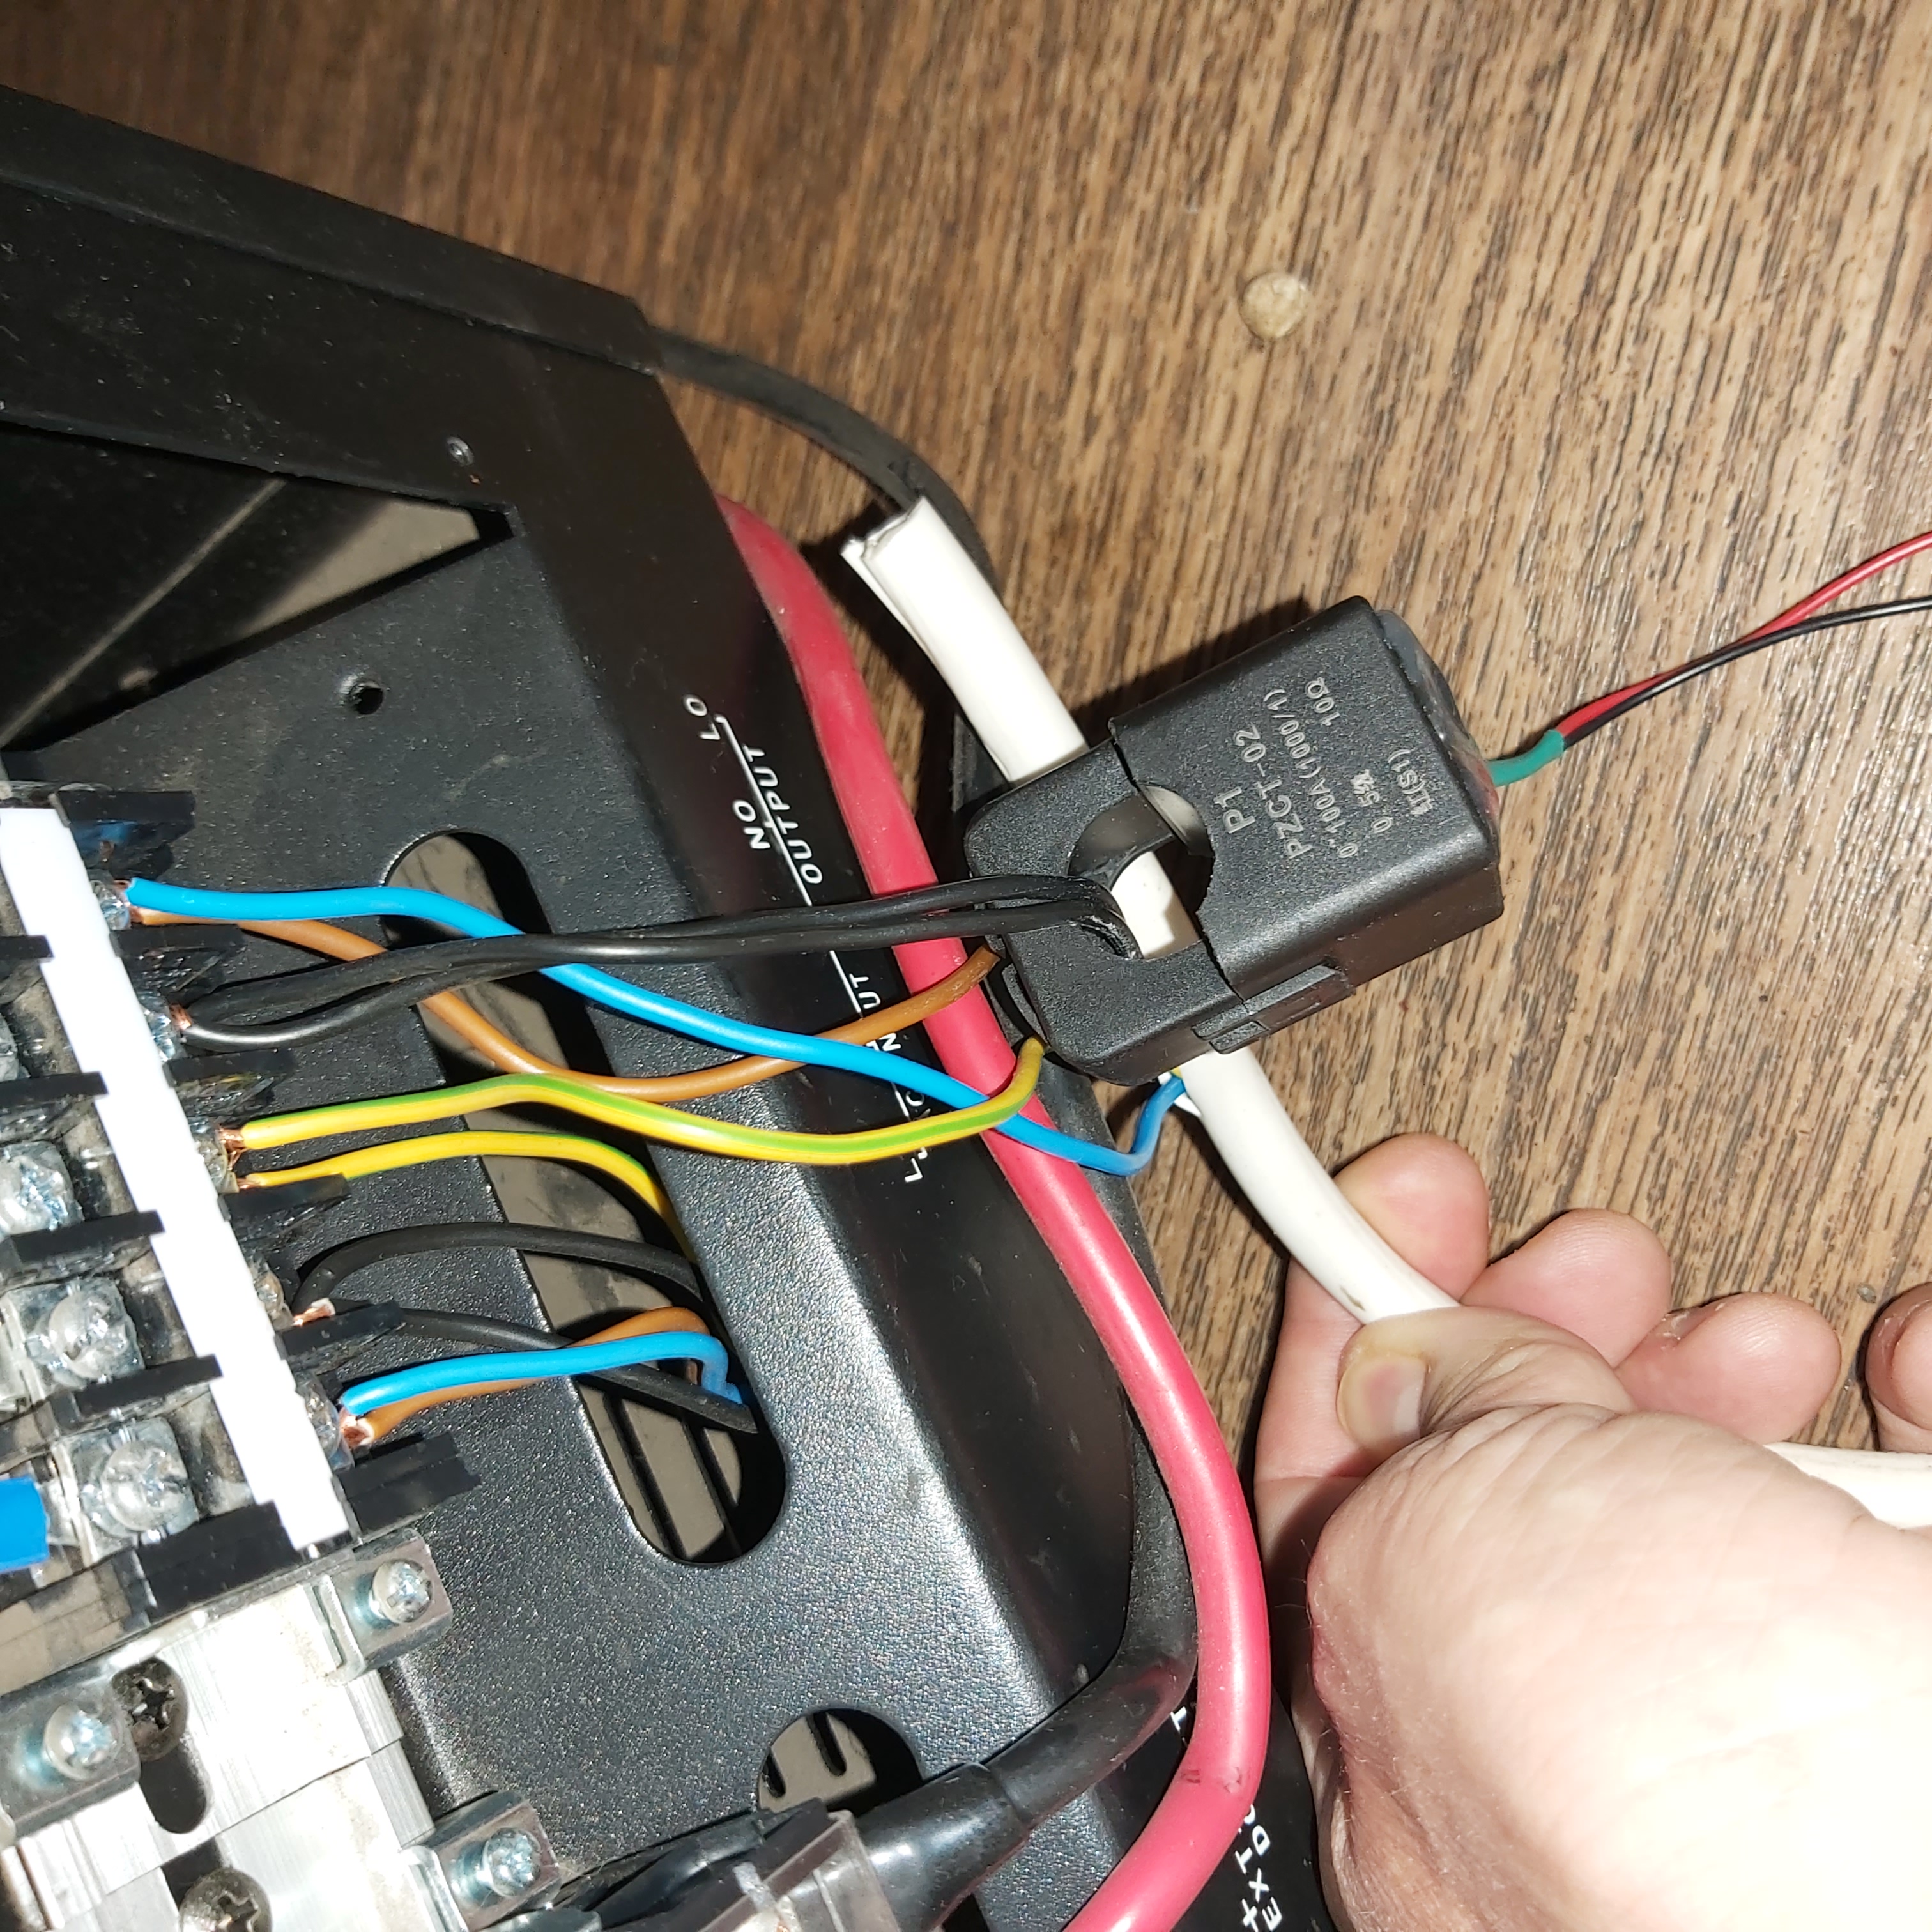
After the sketch is installed and the meter is assembled, it can be connected to the load network that powers the GDS 500A spectrometer.
- Power - consumed power in kW
- Voltage - output voltage
- Energy - power consumption counter in kWh
- Current - consumed current
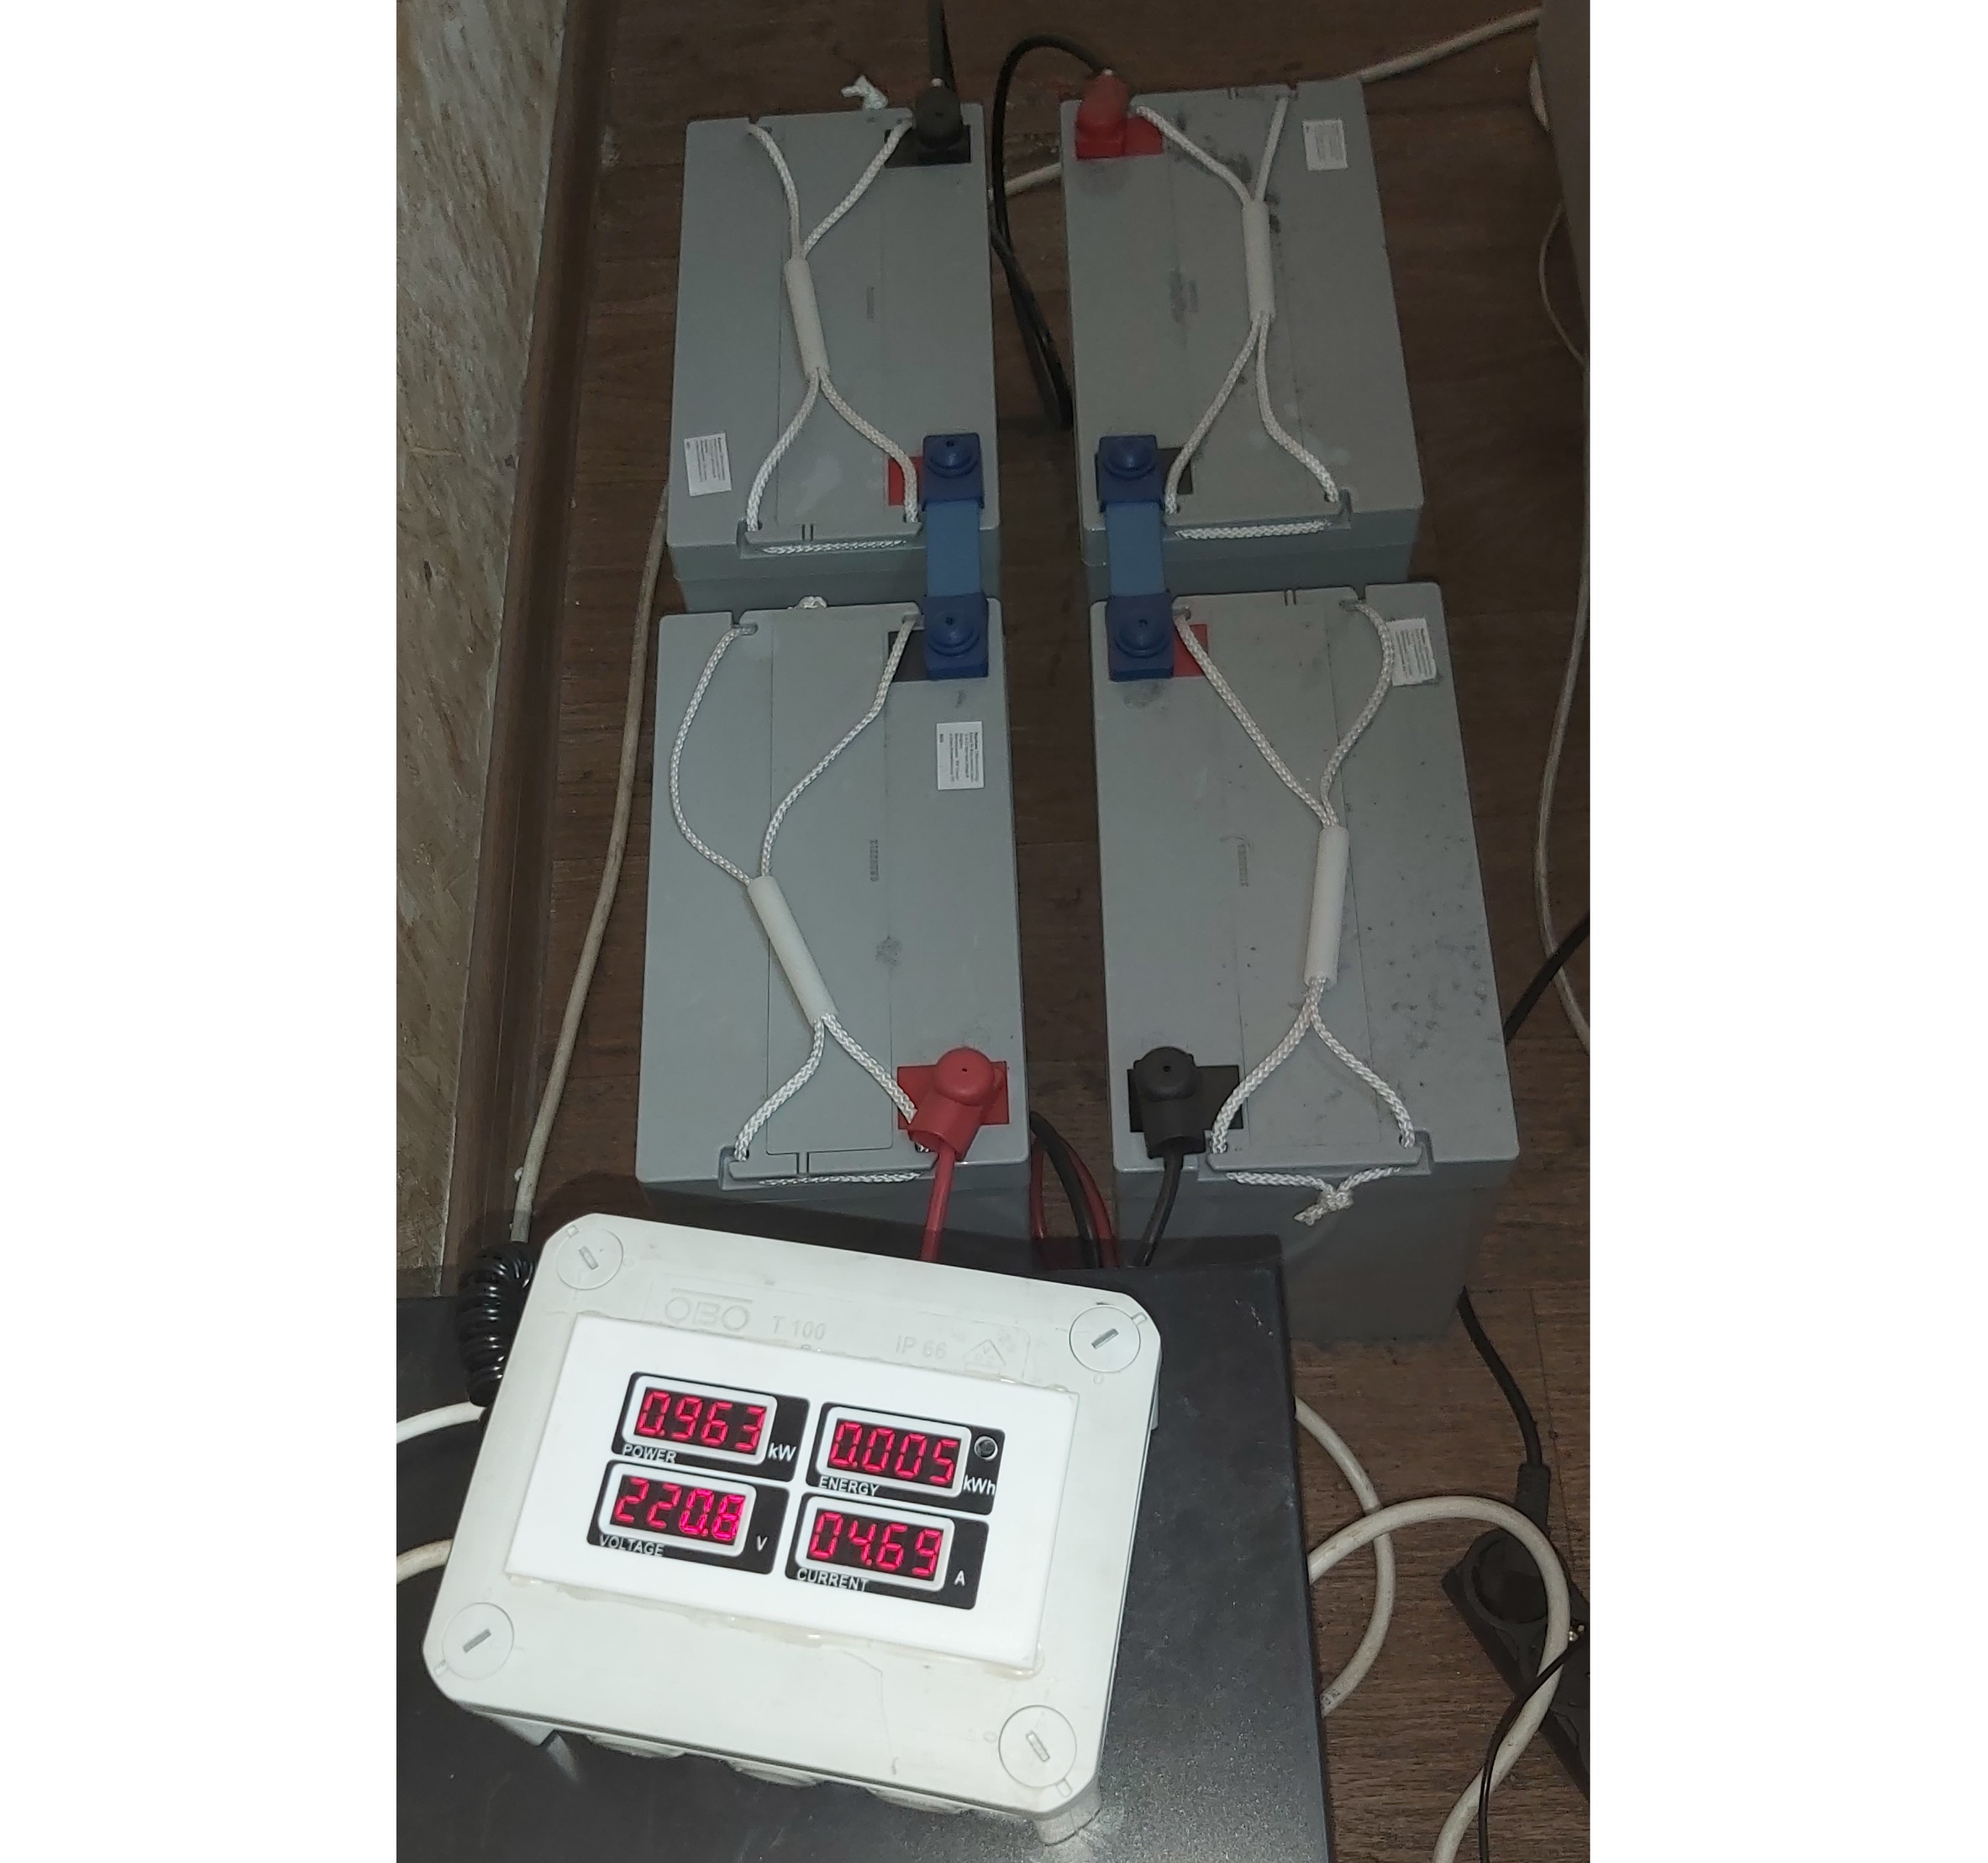
Remote Monitoring with VizIoT
Remote control allows the user to monitor the status and parameters of electrical equipment remotely, providing convenience and operational management. Modern technologies allow organizing remote control over various parameters of electrical systems, such as voltage, current, power, and others.
Advantages of Remote Control:
- Real-time Monitoring: Ability to receive up-to-date information about the parameters of the electrical network.
- Notifications: Receiving alerts about critical parameter changes or malfunctions.
- Historical Data: Collecting and storing data for subsequent analysis and forecasting.
- Communication Interfaces: Using various interfaces (e.g., Wi-Fi) to transmit data to remote devices.
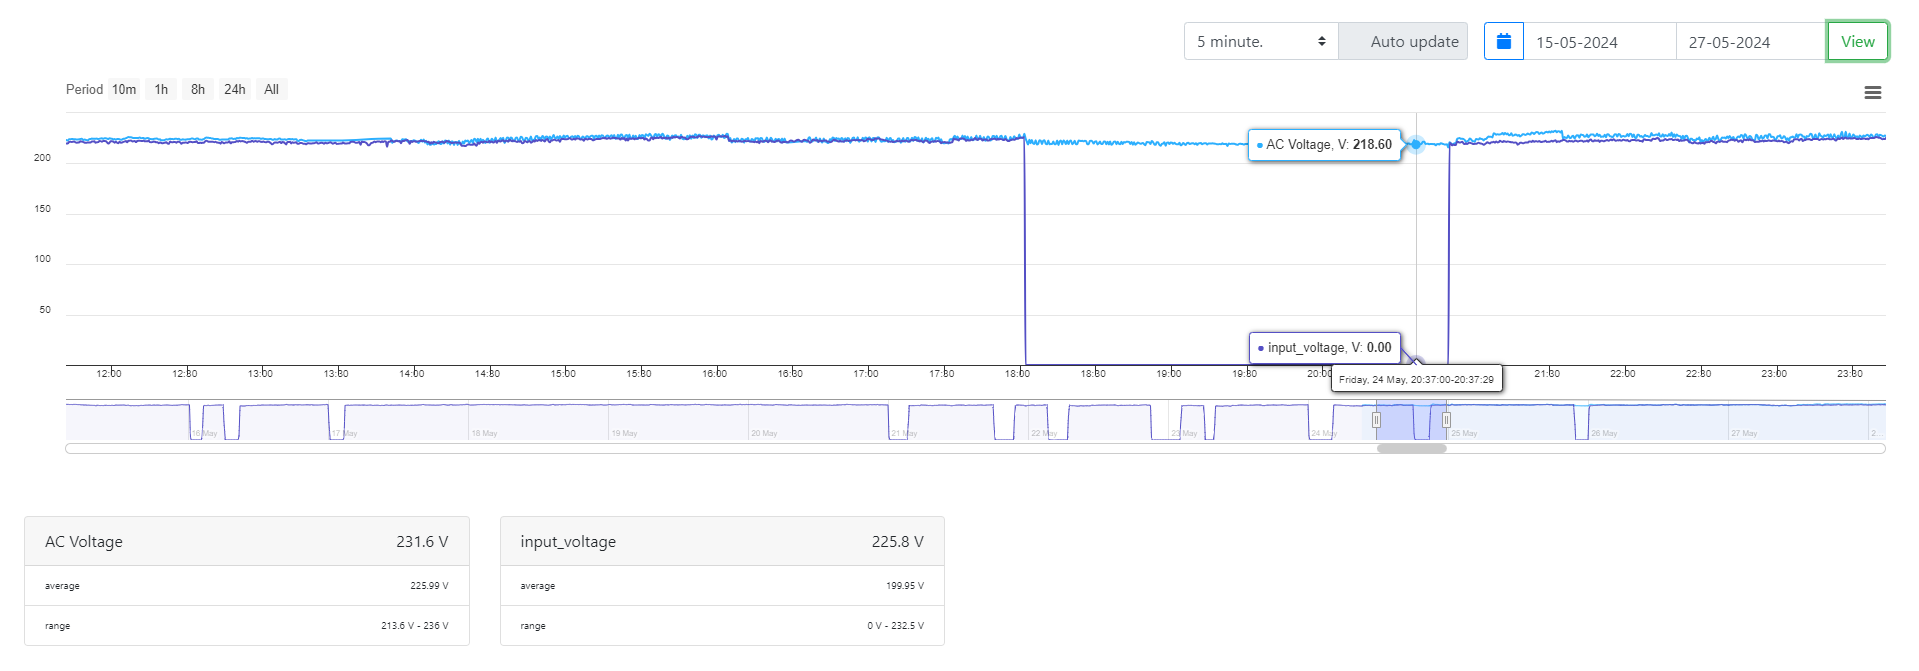
As described above, in addition to the PZEM-004 meter, our scheme involves the Wi-Fi ESP8266 ESP-12 mini D1 module, connected to the meter and capable of transmitting information to the VizIoT server via Wi-Fi. Using the widget panel, we display the received information as follows:

Conclusion
Implementing systems like VizIoT not only increases the level of control and management but also contributes to resource savings, efficiency, and reliability of critical objects. In the future, it is planned to expand the capabilities of VizIoT, making it an even more useful tool for various industries and applications.