Connection and setup ESP8266 to Arduino IDE
This algorithm is current as of April 24, 2024, operating system Mac OS.
Programming the ESP8266 module to control the on-board LED is quite simple if you use the following installation and configuration steps correctly.
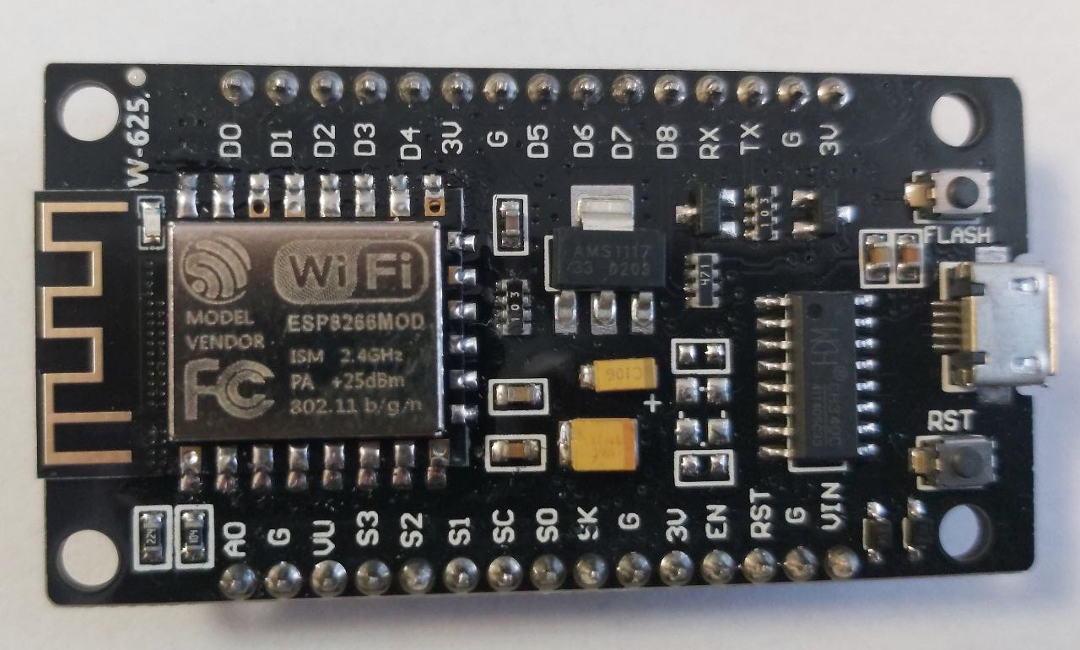
The whole process may take no more than 30 minutes, depending on the Internet speed, computer settings and time that you spent connecting the module to your computer. We will use the Wi-Fi module NodeMCU V3 ESP8266 ESP-12 (CH340):
1. Installing Arduino IDE
To get started, you need to download and install the Arduino IDE application, designed for creating and loading programs onto Arduino-compatible boards. To do this, download the Arduino IDE from the official website arduino.cc :
- Go to the official website arduino.cc .
- Select your operating system, in our case we chose Mac OS.
- After selecting the operating system, we go to the page https://www.arduino.cc/en/donate/ where we click JUST DOWNLOAD

- Then on the page that opens you can subscribe to news from arduino.cc or simply ignore the subscription and click JUST DOWNLOAD

- Hurray, we received the installation file, let's launch it.
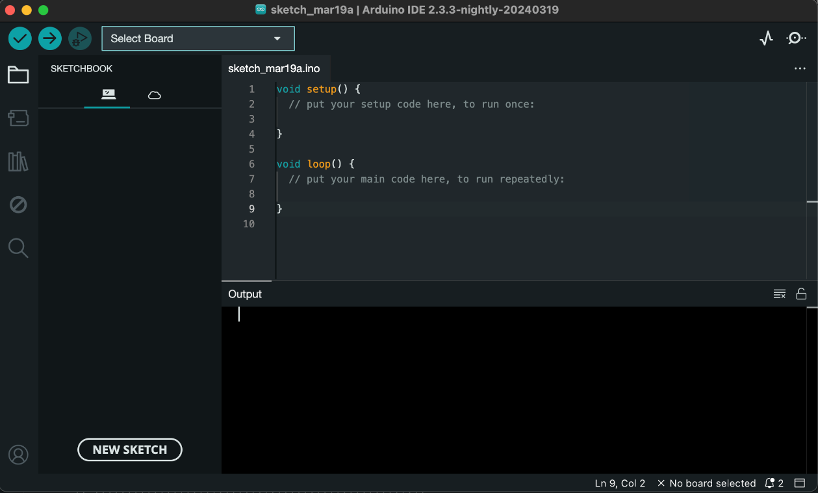
- As a result, the start window of the Arduino IDE program opens:
After installing the Arduino IDE, you need to download the required boards for the ESP8266 microcontroller:

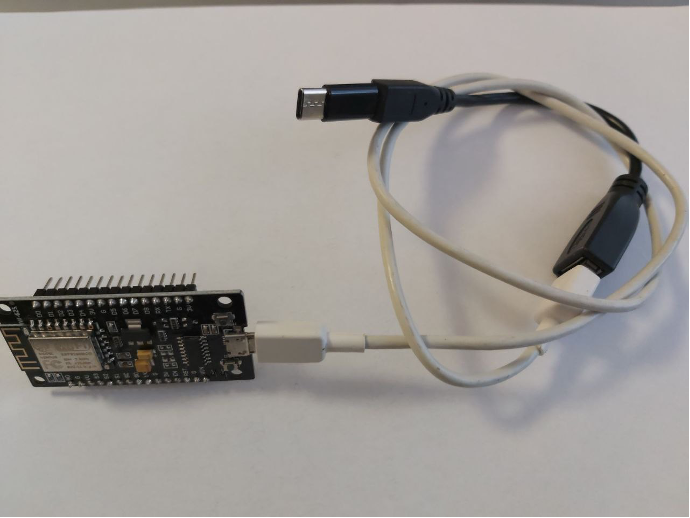
2. Connecting to a computer
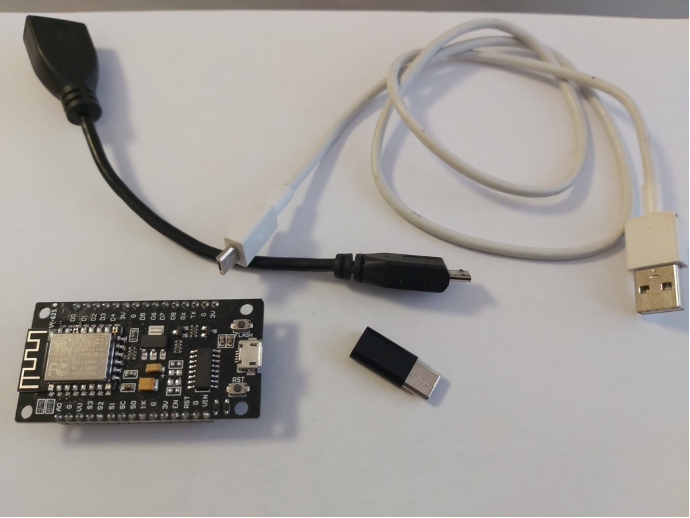
In this case, micro-USB to USB Type-C adapters were used, since the module has a connection socket with a micro-USB connector, and the computer only has USB Type-C. Communication kit:
3. A simple example of LED control
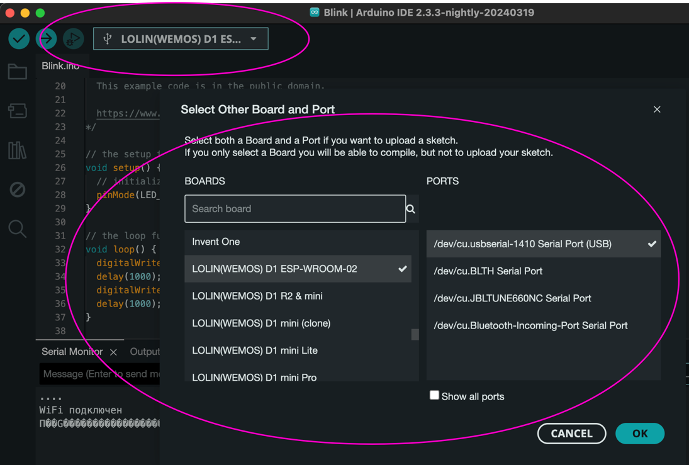
To communicate with a computer, you need to define a port (USB connector), which can be found empirically by plugging and unplugging the module from the computer's USB port, in my case 1410. Then you need to connect the board, in this case I used LOLIN(WEMOS) D1 ESP-WROOM-02
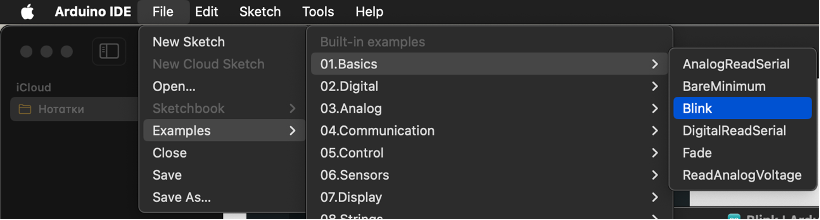
file -> examples -> 01.Basics -> Blink in the Arduino IDE menu.
delay parameter:

And looking at the board where the LED is blinking at 1 second intervals:
By changing thedelay, you can reconfigure the period when the diode is turned on, after which you need to repeat the upload, wait until the module is flashed and make sure that the diode is operating correctly.
Video instructions for changing the on/off period of the diode are available below:
Result of the module running with the new firmware:
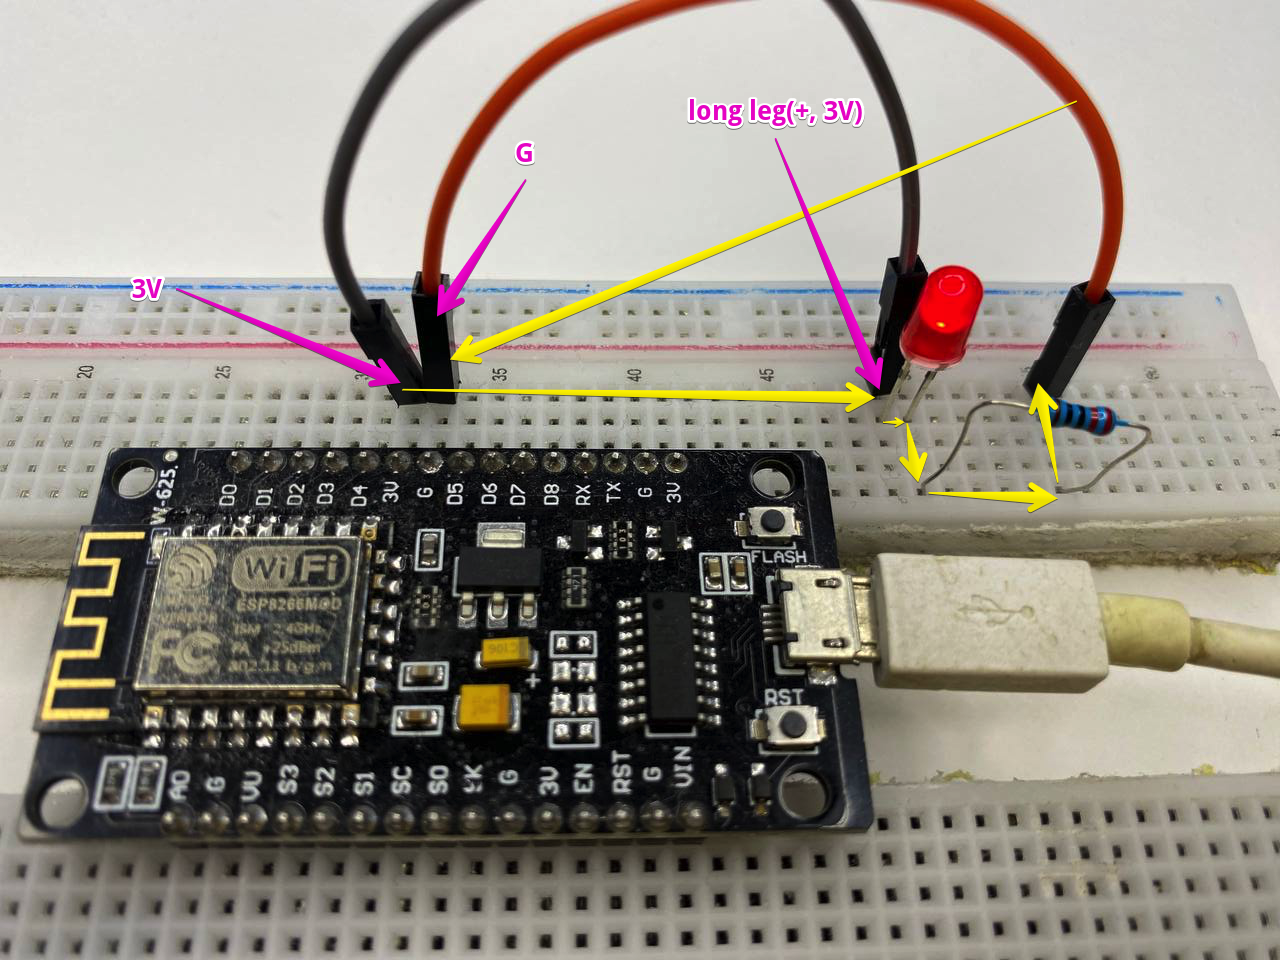
4. Let's assemble our first device - External blinking LED (blink)
We will need:
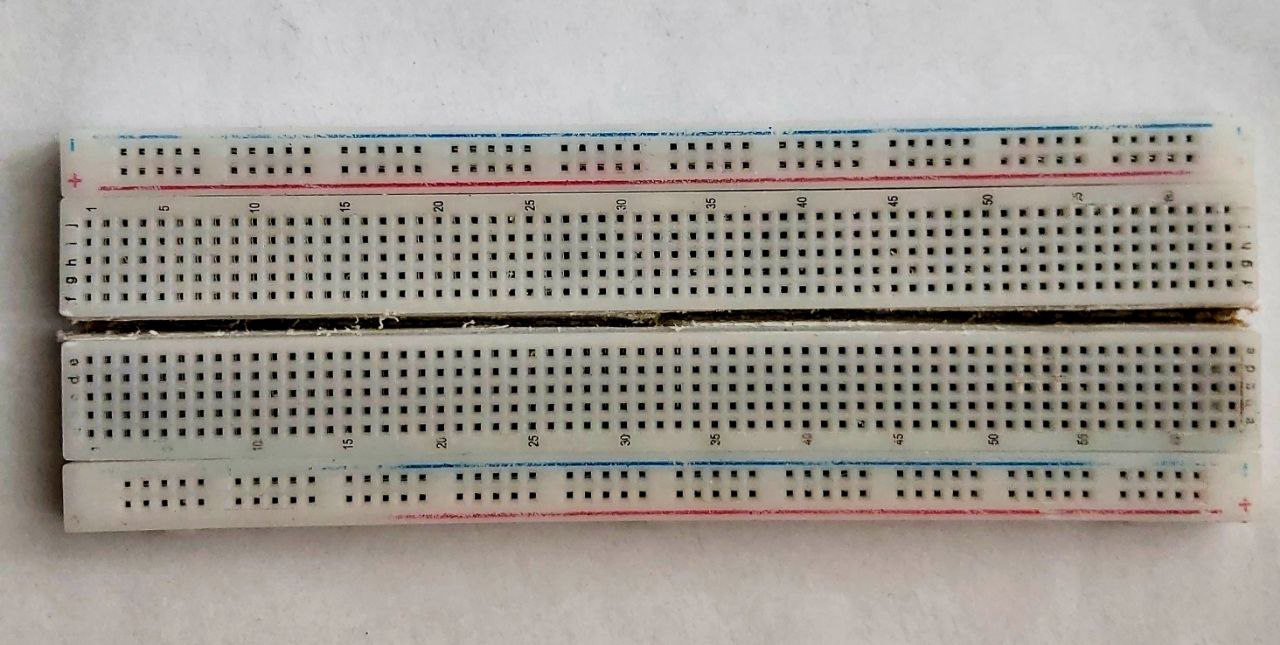
- Breadboard MB-102 - Let's do a little magic on the breadboard, namely we will cut it, because our ESP8266 doesn't fit on it.
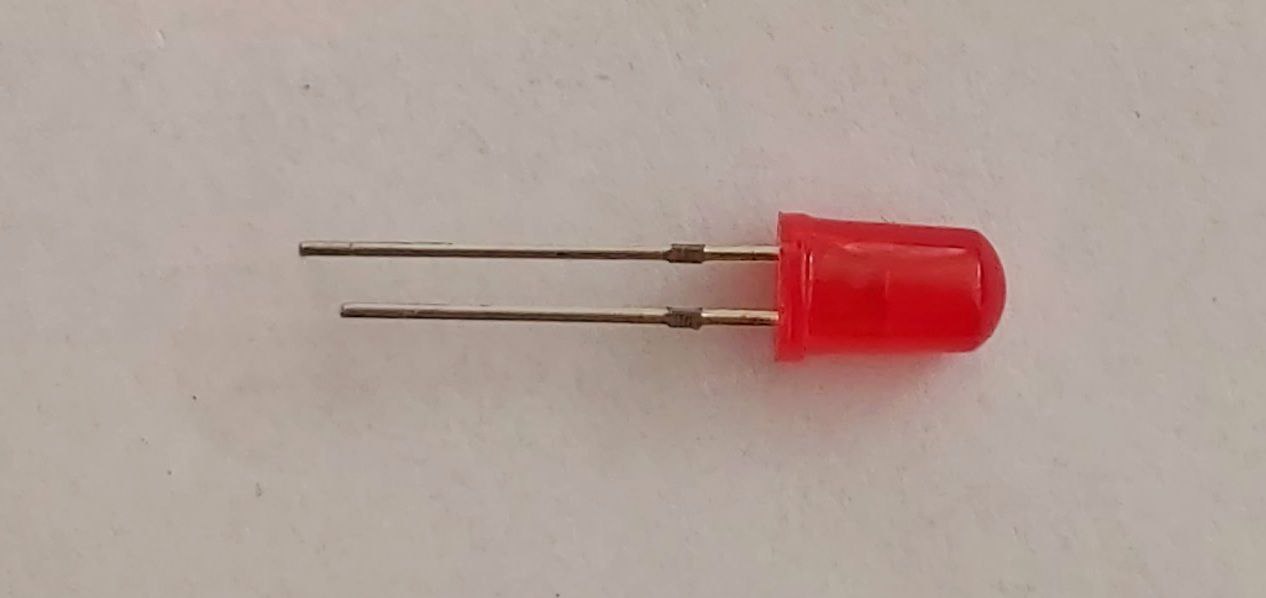
- LED, diam: 5 mm, supply voltage: 2 - 2,8v.
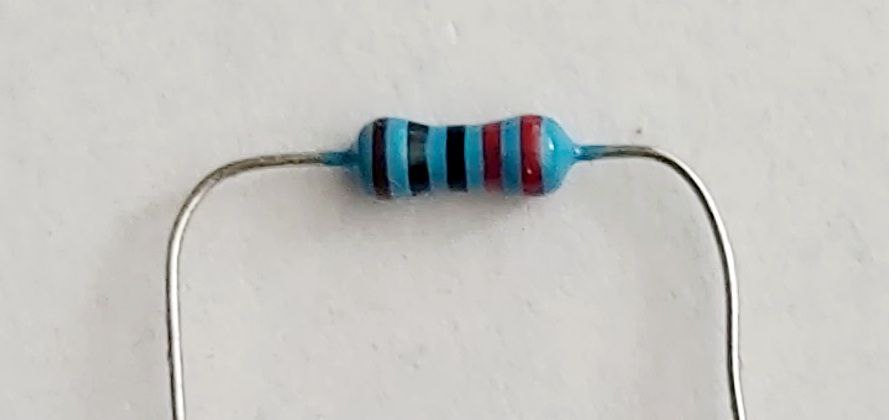
- resistor 220 Ohm.
5. Connecting and checking the functionality of the LED
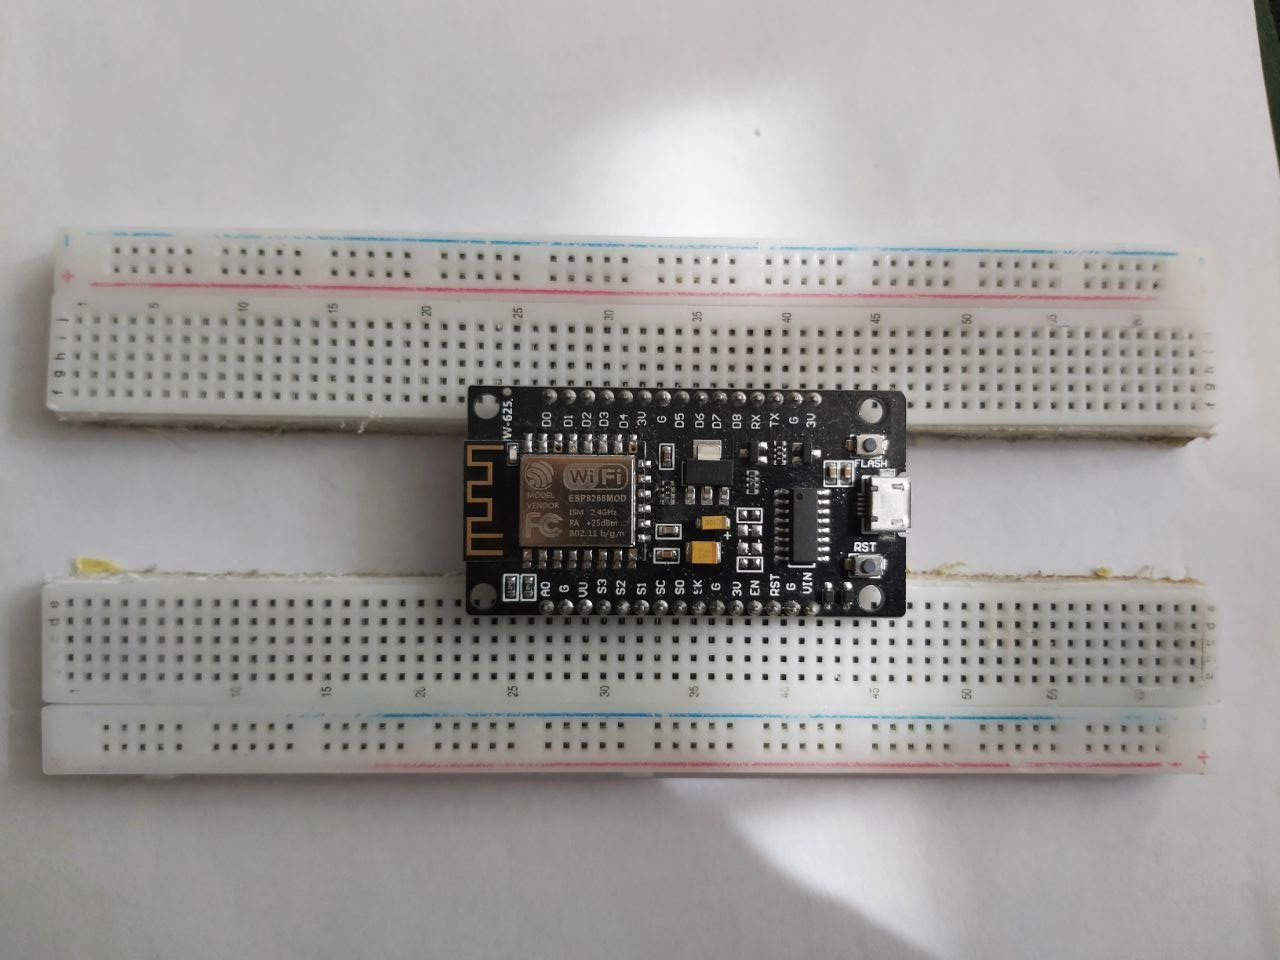
Install the ESP8266 on the breadboard:
6. Changing the address of the LED leg on ESP8266.
To control an external LED, change the LED plus connection from pin with label 3v to pin with label D0. And let's also update sketch, in which we change the constants in the source code below, where in the first parameter of the function pinMode we set the address D0 instead of LED_BUILTIN.
Also edit the loop function, where in both digitalWrite functions we change the name of the first parameter LED_BUILTIN to D0
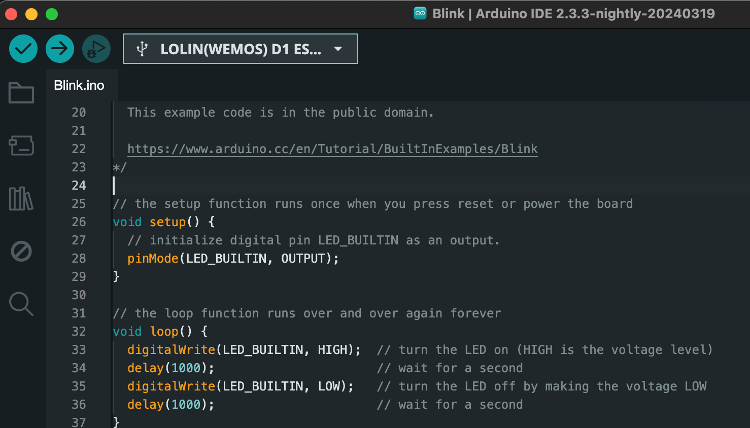
Initial code:
void setup() {
  // initialize digital pin LED_BUILTIN as an output.
  pinMode(LED_BUILTIN, OUTPUT);
}

// the loop function runs over and over again forever
void loop() {
  digitalWrite(LED_BUILTIN, HIGH);  // turn the LED on (HIGH is the voltage level)
  delay(1000);                      // wait for a second
  digitalWrite(LED_BUILTIN, LOW);   // turn the LED off by making the voltage LOW
  delay(1000);                      // wait for a second
}
Converted code:
void setup() {
// initialize digital pin LED_BUILTIN as an output.
pinMode(D0, OUTPUT);
}
// the loop function runs over and over again forever
void loop() {
digitalWrite(D0, HIGH); // turn the LED on (HIGH is the voltage level)
delay(1000); // wait for a second
digitalWrite(D0, LOW); // turn the LED off by making the voltage LOW
delay(1000); // wait for a second
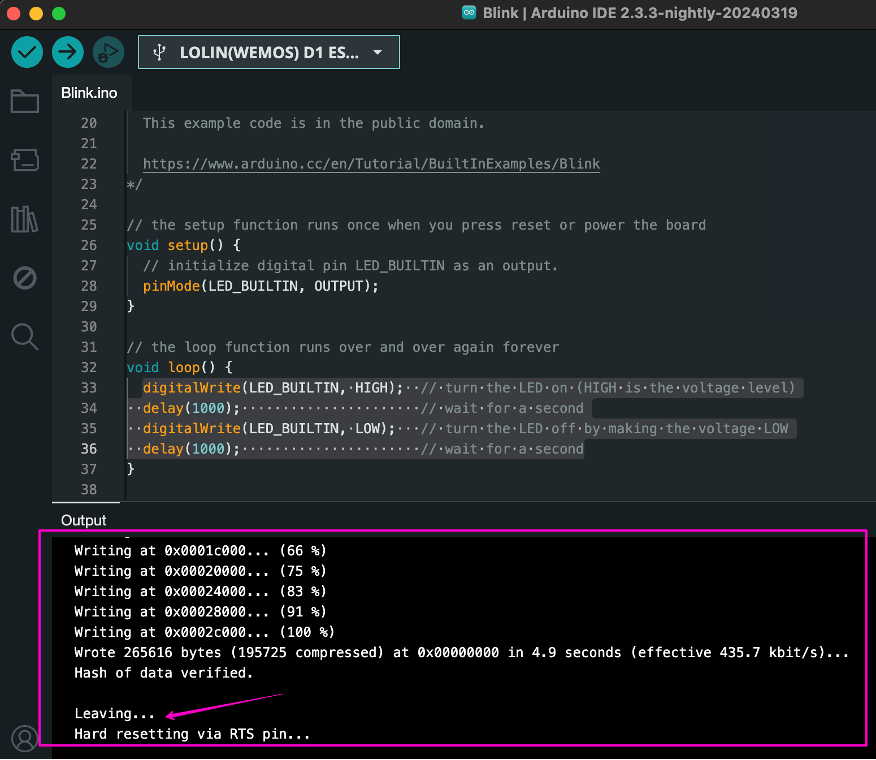
}Click upload

If the LED does not blink, then it may have burned out and we can check the functionality of this sketch using a multimeter.
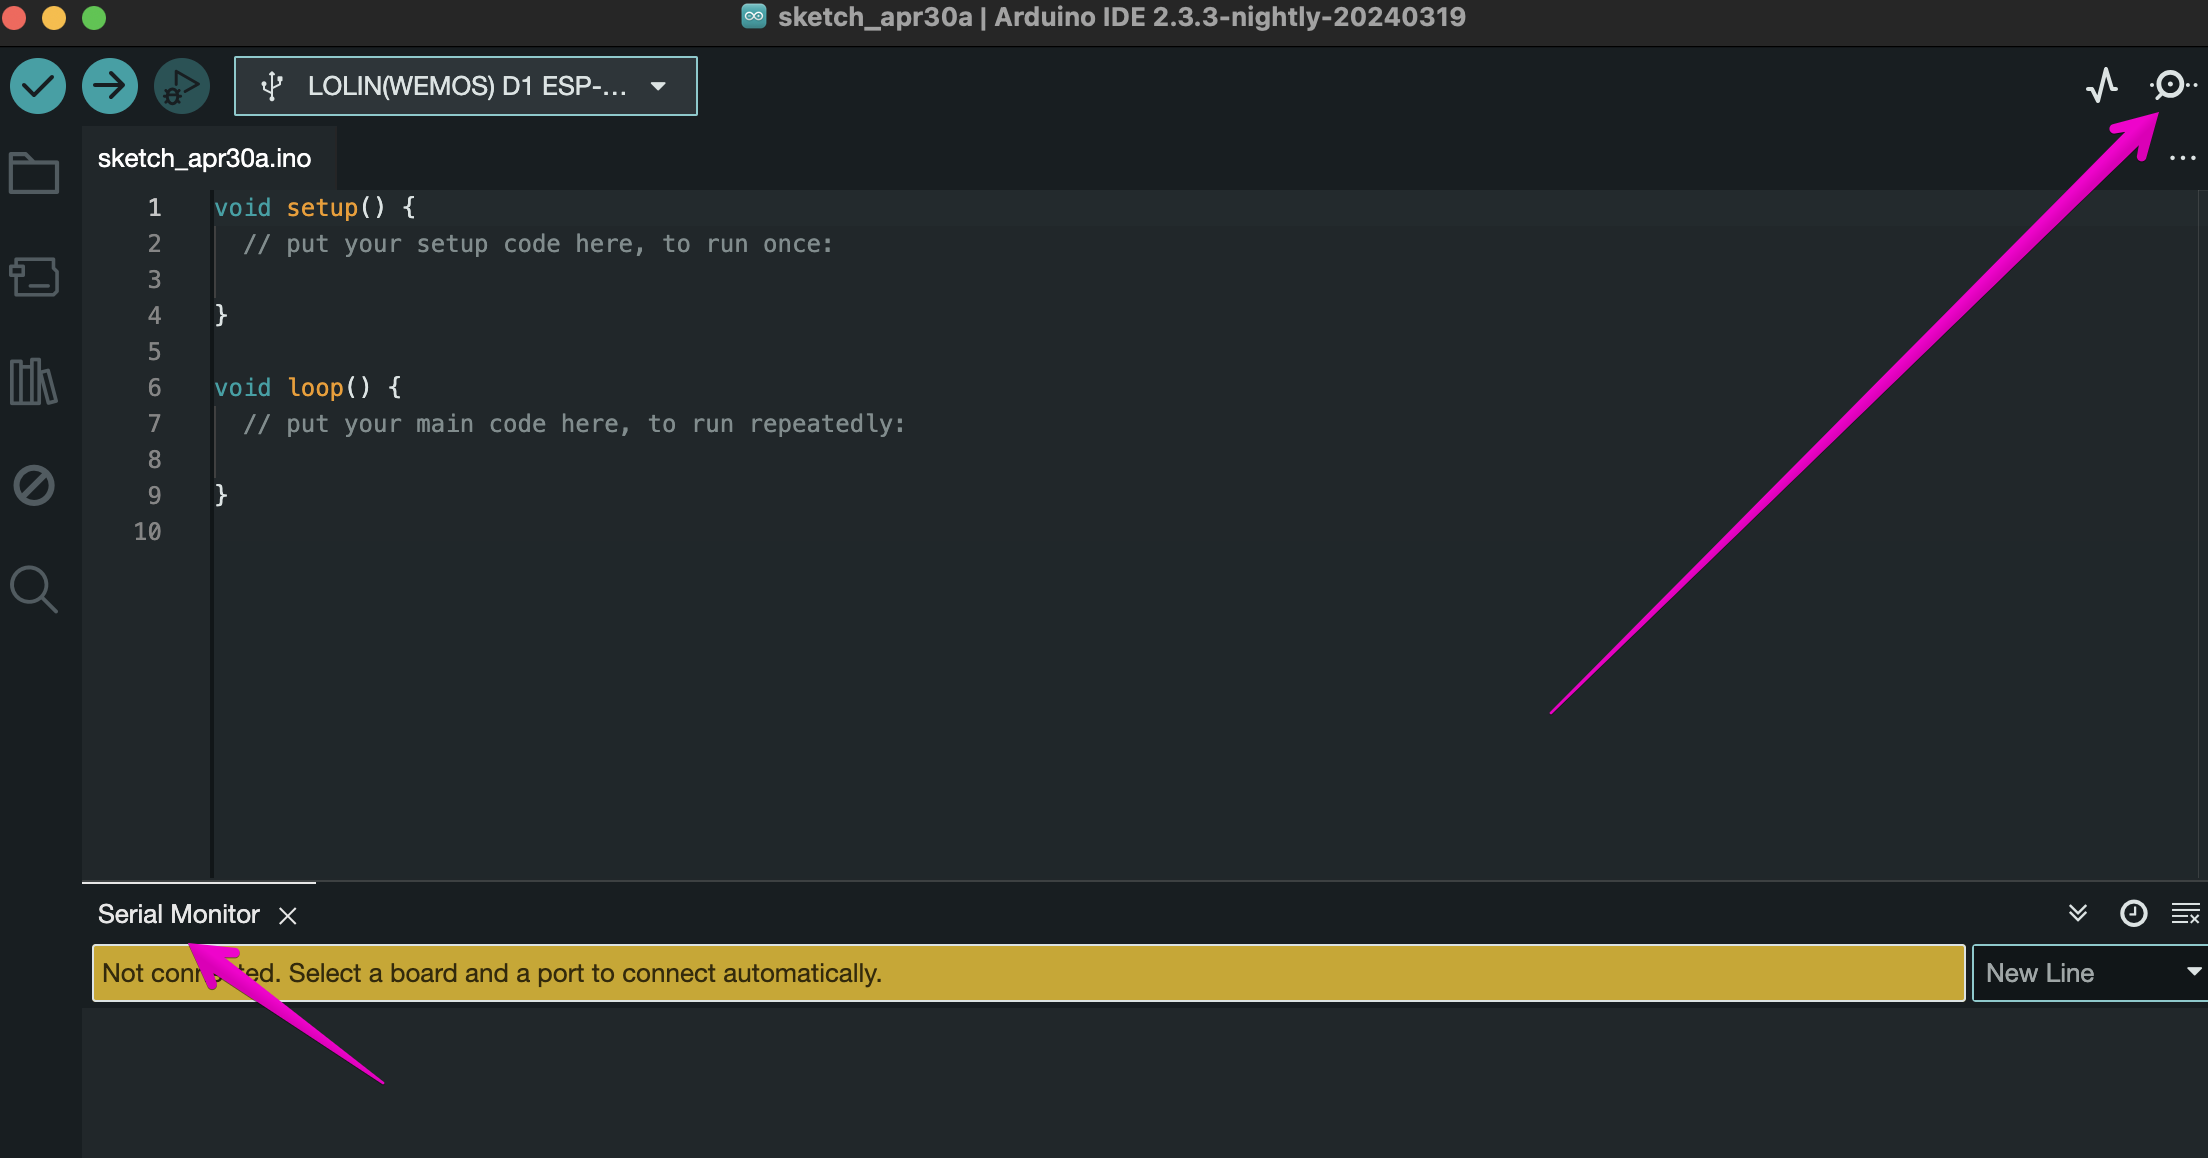
7. Outputting information to the Serial Monitor
Before we get started with the next block, let's learn how to send and read information in a serial monitor. The serial monitor is a built-in console that is included in the Arduino IDE. In the upper right corner you can see a button with a magnifying glass, it opens the console to us.
setup and the begin method, where in brackets we specify the communication speed with Arduino (115200), so that it opens when launched:
void setup() {
Serial.begin(115200);
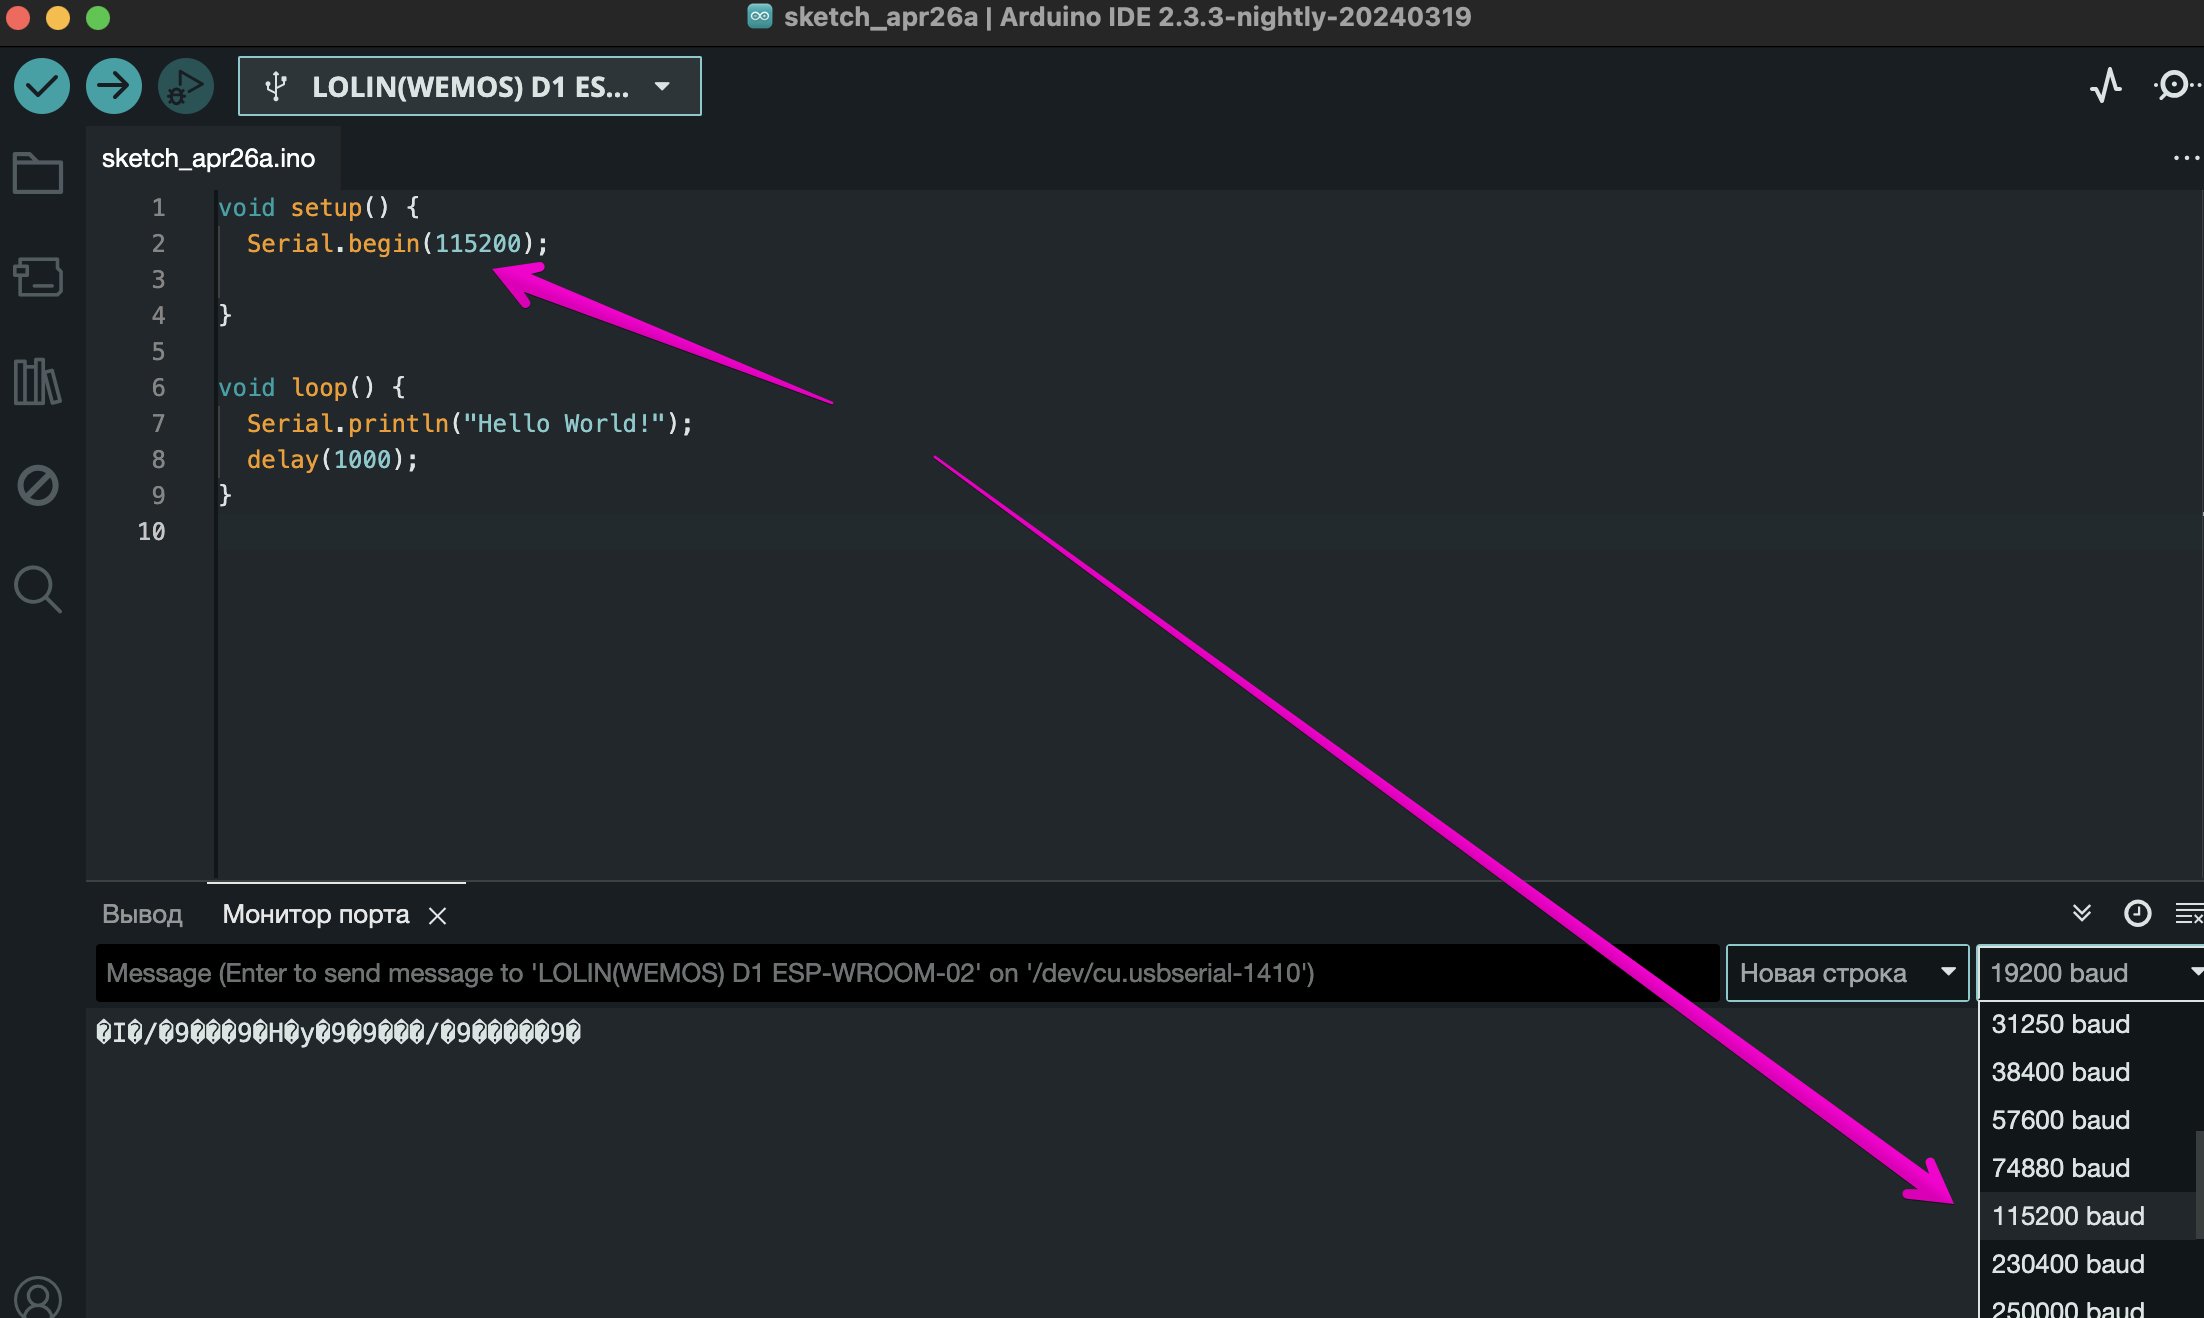
}To send information to the port, for example, "Hello, world", let's use the println() method and print this phrase to the console every 1 second using the following code:
void setup() {
Serial.begin(115200);
}
void loop() {
Serial.println("Hello World!");
delay(1000);
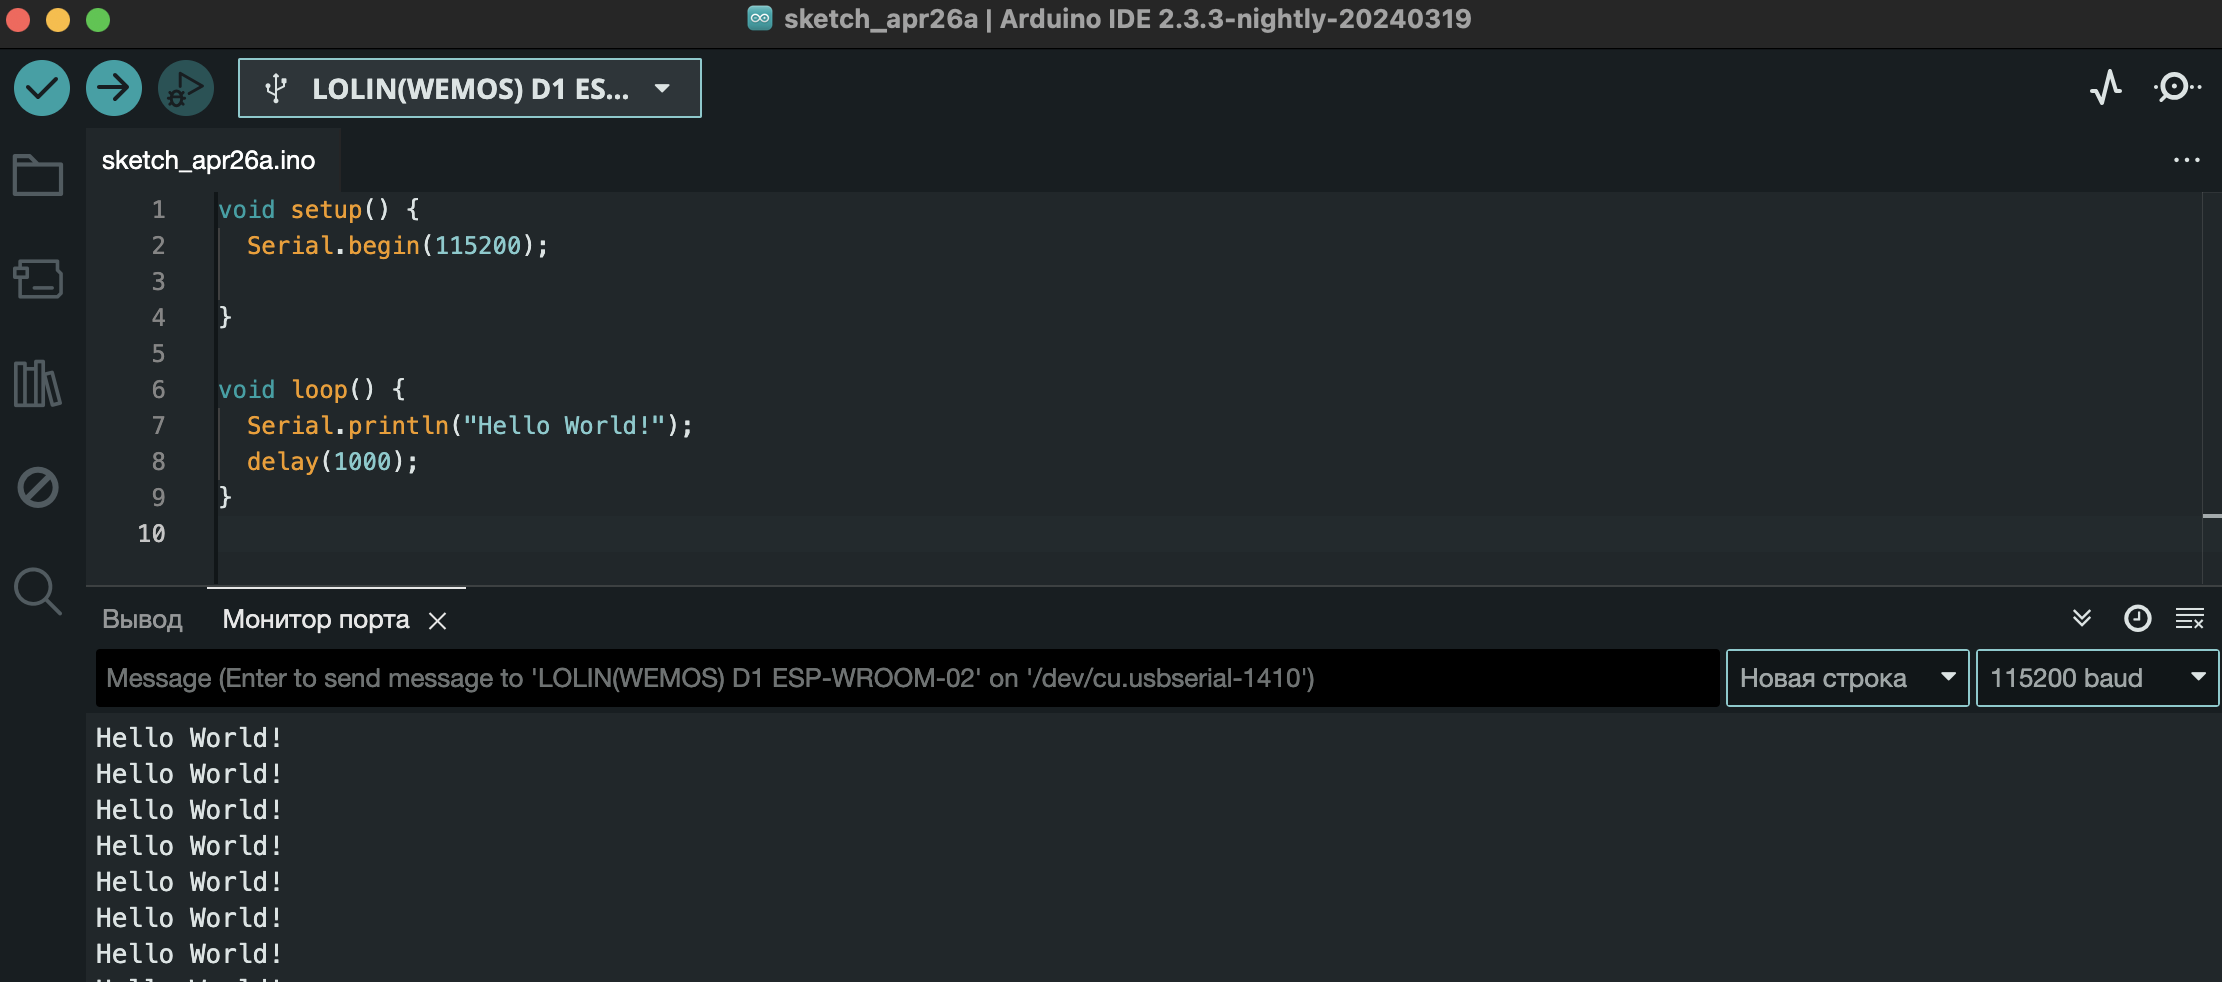
}But that’s not all, after we’ve uploaded the sketch, open the port and select the speed that we specified in the begin method:
8. Connecting to a WI-FI network
The main feature of the ESP8266 microcontroller is the ability to connect and transfer data over Wi-Fi network. Let's go through the instructions for connecting the module to a Wi-Fi network. To do this, we will need a ready-made sketch, where we will need to enter the name of the network (ssid) to which we need to connect and the password for it. To work on a Wi-Fi network, you should use the built-in library ESP8266WiFi.h
#include "ESP8266WiFi.h"
// WiFi parameters to be configured
const char* ssid = "xxxx"; // youe name of ssid
const char* password = "xxxx"; // your password
void setup(void)
{
Serial.begin(115200);
// Connect to WiFi
WiFi.begin(ssid, password);
}
void loop() {
while (WiFi.status() != WL_CONNECTED) {
delay(500);
Serial.print("try to connect WiFi: ");
Serial.println(ssid);
}
Serial.print("WiFi connected to ssid: ");Serial.println(ssid);
// Print the IP address
// Serial.println(WiFi.localIP());
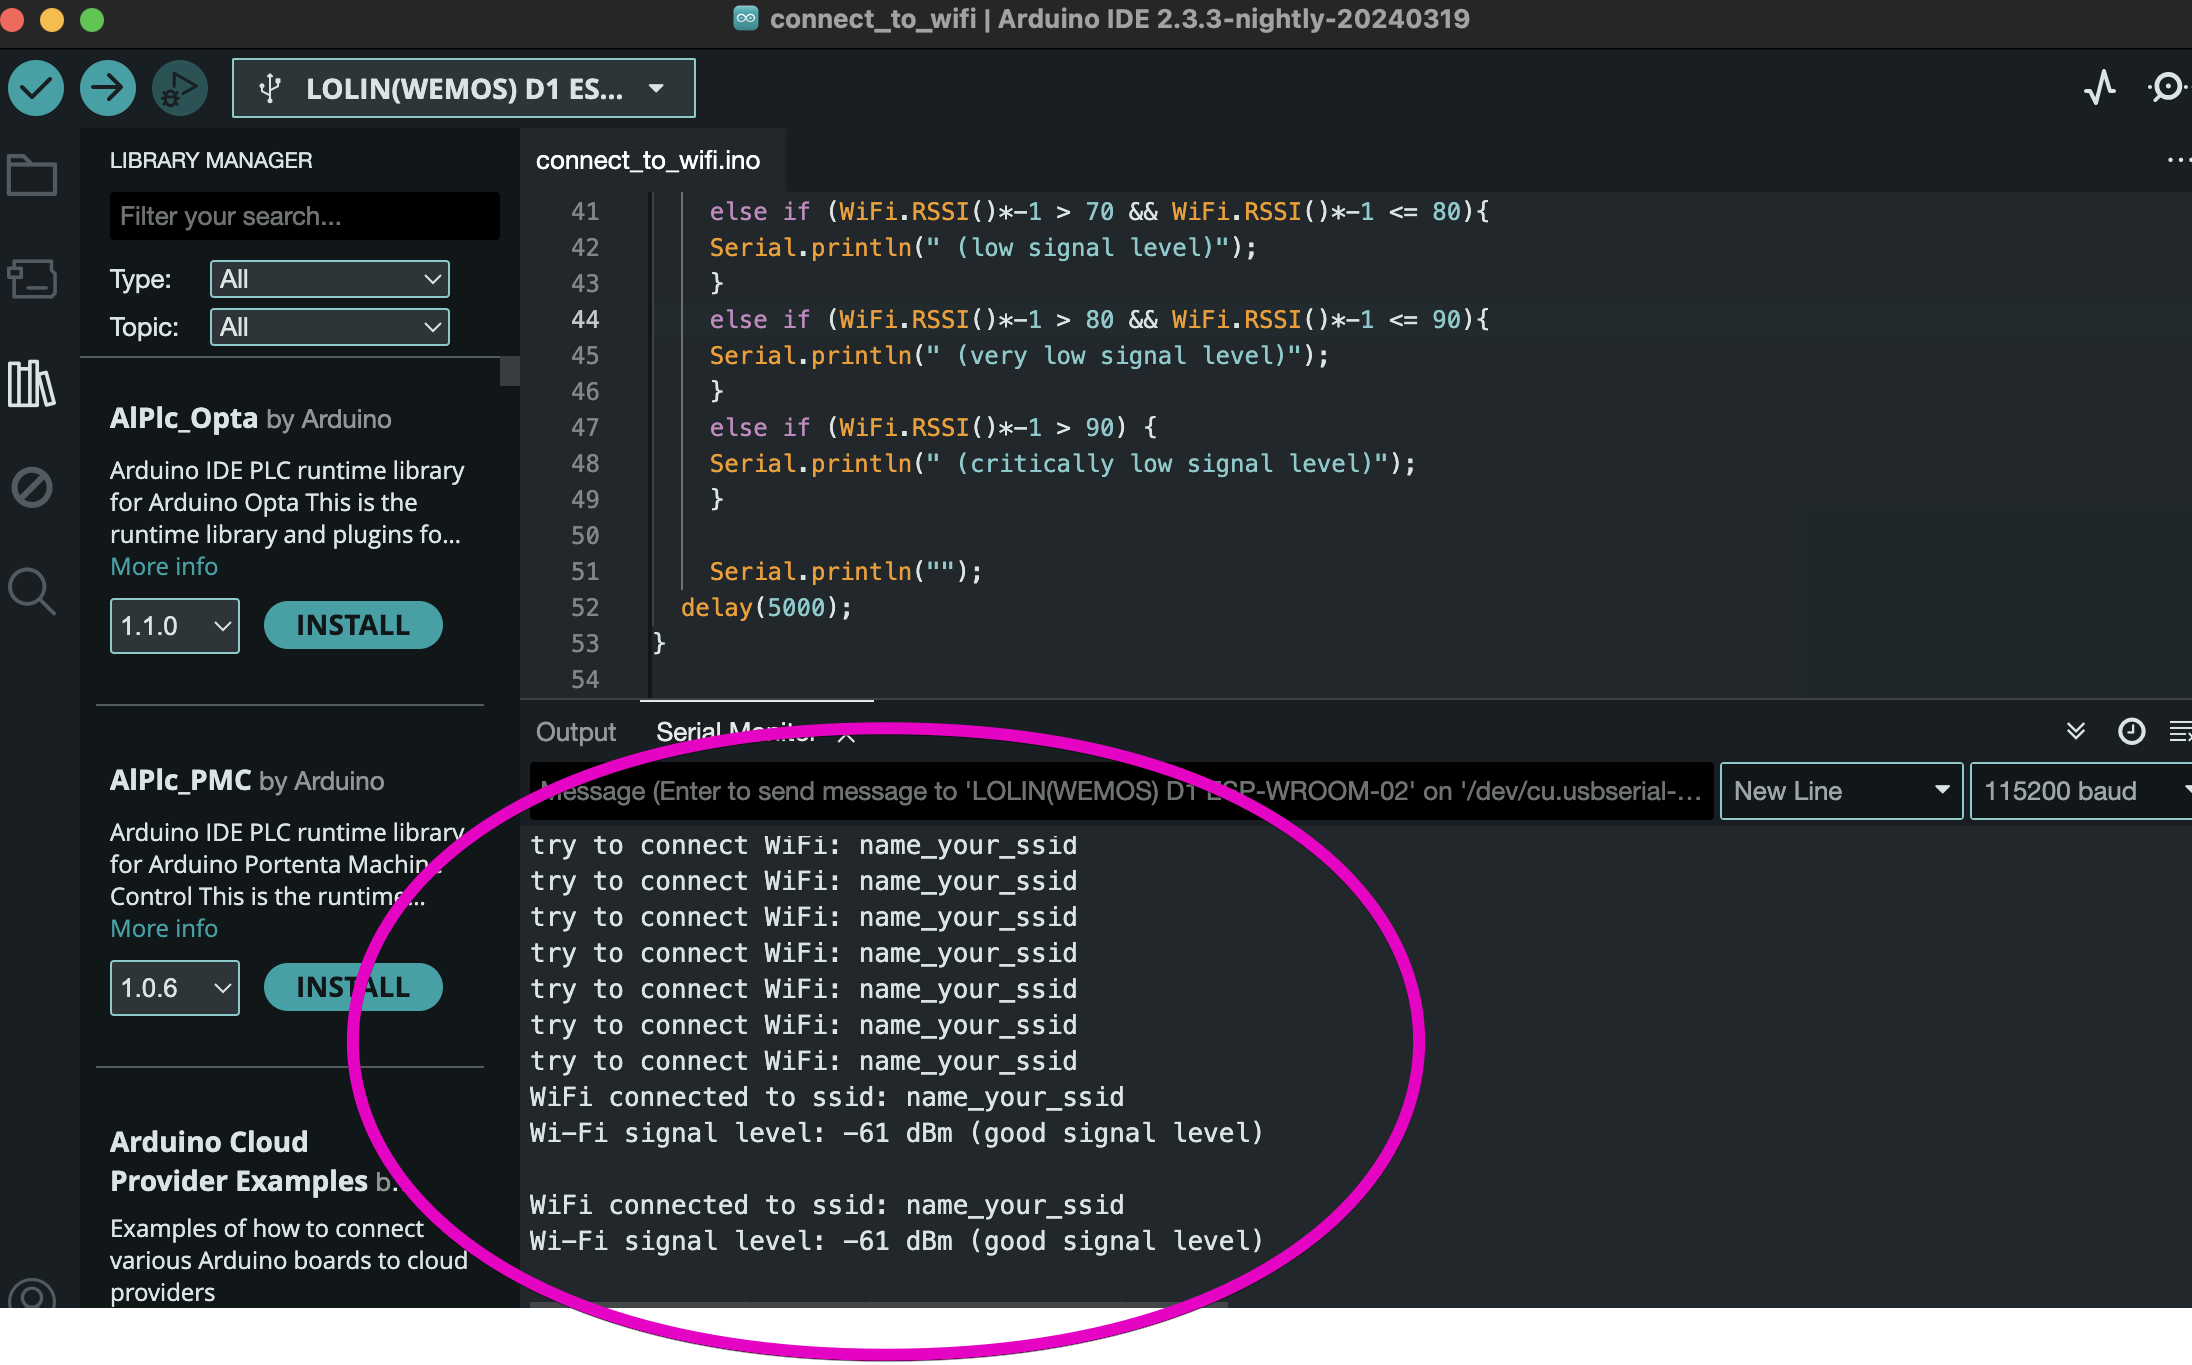
Serial.print("level WiFi signal: ");Serial.print(WiFi.RSSI());Serial.print(" dBm");
if (WiFi.RSSI()*-1 <= 60){
Serial.println(" (excellent signal level)");}
else if (WiFi.RSSI()*-1 > 60 && WiFi.RSSI()*-1 <= 70){
Serial.println(" (good signal level)");
}
else if (WiFi.RSSI()*-1 > 70 && WiFi.RSSI()*-1 <= 80){
Serial.println(" (low signal level)");
}
else if (WiFi.RSSI()*-1 > 80 && WiFi.RSSI()*-1 <= 90){
Serial.println(" (very low signal level)");
}
else if (WiFi.RSSI()*-1 > 90) {
Serial.println(" (critically low signal level)");
}
Serial.println("");
delay(5000);
}If you correctly enter the network name (ssid) and password, approximately the following information will appear in your console (serial monitor):
- up to -60 dBm - excellent signal level;
- from -60 dBm до -70 dBm - good signal level;
- from -70 dBm до -80 dBm - low signal level;
- from -80 dBm до - 90 dBm - very low signal level;
- over -90 dBm - critically low signal level;